Tools and Troubleshooting
Tools
Several tools are provided that can aid in using and managing the installation:
Actian Director
Director is a Java based graphical tool for administering and connecting to the database. It can be installed on any machine that runs Java (including Windows and Linux) and manages remote installations. It can be downloaded from the Actian website.
infodb
Shows the databases managed by the current instance, including both user databases (for example, pocdb) and system databases (for example, iidbdb).
ingstatus
Shows the running state of the servers that make up the current instance.
ingprenv
Shows the configuration (the symbol table) of the current installation. Note that these are separate from Linux environment variables (such as II_SYSTEM).
vwinfo
Shows the memory state, transaction state, storage state, and configuration details of a database, depending on the command flags used.
sql (the Terminal Monitor)
Is a command line tool for issuing commands to the database.
vwadmin
Provides a menu style interface to many useful Actian and Linux utilities. This may be the best starting point for a Linux command-line user new to Actian software.
x100profgraph
Can be found in the “sig” folder of a Vector or VectorH installation, and is designed to provide graphical output of a text-based query profile. Generate a text file with query profile information by issuing the following before running an SQL statement:
call vectorwise (setconf 'server, profile_file, ''/tmp/profile-path''');\g
Then, pass this profile information as input to x100profgraph to get a visual representation of a query profile, which is useful in diagnosing query performance issues.
Actiancorp/VectorTools
Provides a collection of tools (downloadable from the Actian GitHub site) to assist in working with Vector and VectorH. These tools let you:
• Detect data skew in a table
• Calculate the correct number of partitions for a large table
• Check whether Vector's min-max indexes are showing sorted data and hence working effectively
• Automatically execute a collection of SQL scripts against a database to test performance.
Detailed “production level” monitoring is beyond the scope of this document. It can be provided, however, by augmenting the above with the Actian Enterprise Monitoring Appliance (EMA). See
References and Further Information, Reference #3.
In addition to the above Actian tools, other third-party tools can be used during an evaluation. For example, to simulate the actions of a number of concurrent users, a tool such as Apache JMeter (
http://jmeter.apache.org/) is useful.
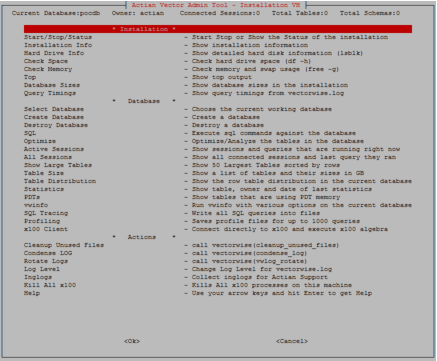
vwadmin Utility
A VectorH installation includes utilities that are useful in certain diagnostic and support situations. The utilities are provided in the sig subdirectory of the installation. One of these is a multi-functional administration interface called vwadmin.
To run the tool execute: ${II_SYSTEM}/ingres/sig/vwadmin/vwadmin
A screenshot of the available commands is shown here:
Note: The vwadmin utility is provided “as is” and not officially supported. Some of the available commands (especially those beneath the “Actions” menu) should be used with care until you are familiar with what they do. Consult the User Guide and SQL Language Guide for more information.