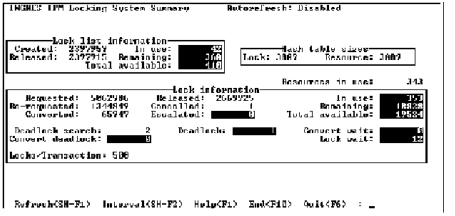
Locking System Summary Screen
The Locking System Summary screen appears when you select Locking System Summary from the Lock Info Menu screen.
The data on this screen helps you to determine which locking parameters need to be adjusted.
Because there is currently no way to view all of the locking parameters used to configure the locking system, keep a record of the parameters in a prominent place when viewing this screen.
Use autorefresh when monitoring this information. The screen autorefreshs if the -r flag was specified at startup or the Display Refresh field on the Option Selection screen was changed to a number between 1 and 999 seconds. For more information, see Option Selection Screen on page 23.
When tests or benchmarks are run, monitor the locking system activity during the test by selecting the Interval menu item and selecting the Start_Now menu item. IPM displays the statistics accumulated since the start time.
If the Interval option was previously enabled, the start time and current time fields appear in the upper right-hand corner of the Locking System Summary screen. To reset the start time (which is the time when the Start_Now menu item is selected), select the Interval menu item and the Start_Now menu item.
The start time and statistics obtained at the start time remains unchanged until the Begin_Now or Since_Startup menu items are selected or the user exits IPM. This allows other functions (for example, logging, other locking, or server information) to be used while accumulating statistics. When the Locking System Summary screen is displayed at a later time, the running totals since the start time are not lost.
When displaying statistics over an interval, you must set the Autorefresh option. This causes the display to be automatically updated.
Last modified date: 07/09/2026