Logging System Header Screen with Transaction Display
When you select the Examine menu item, the Logging System Header screen displays additional transaction information.
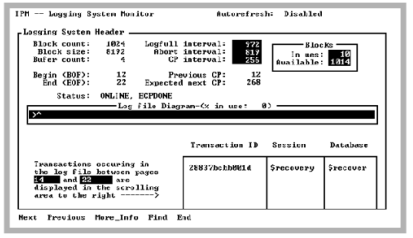
The Log file Diagram field is highlighted and a caret symbol ^ appears in that field marking the position of the log file currently being examined. Any transactions occurring in the range of pages covered by the caret (^) symbol are displayed in the scrolling area. The range of log file pages currently being examined is also displayed.
By using the Next and Previous menu items, you can move the caret symbol to any area of the Log file diagram covered by the arrow (“>----->”). By default, when the Examine menu item is selected, the caret symbol appears at the BOF. The Next menu item can be selected until a user transaction appears in the scrolling area. This transaction is the oldest transaction in the log file and prevents log file space from being reclaimed.
Examine a Particular Position in the Log File
From the Logging System Transaction Display, a position in the log file can be examined.
To examine a particular position in the log file
1. Open the Logging System Transaction Display and move the cursor to the Log file Diagram.
2. Place the cursor (using the arrow keys) anywhere on the arrow representation of the log file, and then select the Examine menu item.
A snapshot is taken of the transactions, as well as the BOF and EOF. A pop-up screen displays the range of log file pages with transactions. The snapshot is used until the Examine submenu is exited.
To obtain the latest state of the logging system
1. Exit the Examine submenu and select Examine again.
Autorefresh, if enabled, is suspended during the Examine phase. Autorefresh is re-enabled when you exit the submenu.
Last modified date: 07/09/2026