Summary Rule
Summary rule ( ) are used to generate aggregate statistics. Aggregation analysis is used to identify the presence of inaccuracies through examining aggregated values over large amounts of data. Derived fields are not created by this type of rule.
Following is a list of Summary Rules:
Distinct Values
Description | Writes all the distinct (unique) values found for the filed into an output file. |
Parameters | • Results File - Displays the distinct values output file. Default is within your project. However, you can change it. • Sort Order Select the required Sort Order from the following: – Field Data (Faster) – Frequency Count (Slower) Note: Frequency Count (Slower) sorts the results in descending order and hence the sorting is slower compared to Field Data sort option. |
Supported Data Types | String, Date, Timestamp, Boolean, Numeric, Double, Float, Long, Integer |
Remarks | The results file name must not contain the following characters: • / • \ • . • , • .. |
Duplicate Values
Description | Writes all duplicate values found in a data set into a file. |
Parameters | • Results File - Displays the duplicate values output file. Default is within your project. However, you can change it. • Sort by Select the Sort Order from the dropdown menu: – Field Data (Faster) – Frequency Count (Slower). Note: Frequency Count (Slower) sorts the results in descending order and hence the sorting is slower compared to Field Data sort option. • Min Count Type the required value. The value must not be lower than 2. The default Min Count is 2. |
Supported Data Types | String, Date, Timestamp, Boolean, Numeric, Double, Float, Long, Integer |
Remarks | The results file name must not contain the following characters: • / • \ • . • , • .. Also, this rule is included as a part of Single Statistics rule. Using Single statics rule includes Min, Max, Mean, Median, Mode, Standard Deviation, Sum, and Variance. |
Duplicate Clusters (Fuzzy Matching)
Description | Duplicate clusters provides you the ability to identify potentially duplicate records by evaluating multiple columns at the same time by using the fuzzy matching rules and match score filter. Real-world data is often dirty and contains variations and errors. Most common examples can be errors in person names, cities, organization names, etc. This could be caused by a spelling mistake. Finding “duplicate” data in this case does not mean finding an exact match but means finding an approximately similar record. Fuzzy Matching (also called Approximate String Matching) is a technique that can be used to filter these similar looking fuzzy duplicates by finding an approximate match. There are many situations where Fuzzy Matching techniques can be used. Let’s look at some real-world examples: • Creating a Single Customer View - A single customer view refers to gathering all the data about customers (stored in multiple tables) and merging it into a single record (stored in a single table). • Data Accuracy - For companies that rely on artificial intelligence and machine learning, data accuracy becomes extremely crucial. Fuzzy string matching can help improve data quality and accuracy. • Fraud Detection - A good fuzzy string matching algorithm can help in detecting fraud within an organization. For example, some (very naughty) people create multiple fake accounts to gain freebies for newly registered accounts. Let us also understand how the cluster technique works. The main idea in clustering is to group similar records together, into clusters or blocks, using the Key Field value from the records. After this all pairs of records are compared only within the individual blocks. Because real-world data are often dirty and contain variations and errors, an important criteria for a good clustering key is its capability to group similar records into the same cluster or group. Thus identifying the key is critical to the success of the cluster method. It is also possible to use a combination of Fields to define a Key Field. For example, assuming that most people enter their first name correctly, we can use a combination key of First Name and City to create a cluster or group of all customer records that have same First Name and City entry. After this a measure such as the Levenshtein distance can be used to calculate the scores between pairs of string fields such as Address to identify duplicate customer records. Note: The output for this Metric Type, unlike other Metric Types, is stored in a separate csv file. |
Parameters | Grouping Tab - Allows you to define which rows to consider for comparison with each other. • Grouping Type - Three grouping types are supported: – Group by Keys - You can move fields from Input Fields to Key Fields to specify fields whose values would be used to create groups of records. For example if you specify “Zip code” as the “Key Field”, multiple groups are created based on Zip code values. Each group consists of records that have the same Zip code. After this, only rows within the group are compared with each other, based on your Matching Tab inputs. Grouping defines the scope of search and reduces the execution time. – Inequality Join - Here too you can move fields from Input Fields to Key Fields, to specify fields whose values would be used to create groups of records. But in this case, the records where the value for the given Key Fields do not match are considered for comparison with each other. – None - No grouping happens and every record in the data is compared with every other record. This might end up running forever (several hours) based on the number of rows in the data. When None is selected, key selection is disabled. • Input Fields - List of available fields (any datatype) that can be used as Key Fields. • Key Fields - You can move fields from Input Fields to Key Fields to specify fields whose values would be used to create groups of records. Records with the same Key Fields value are grouped together. After this, only rows within the group are compared with each other, based on your Matching Tab inputs. Note: You can specify multiple fields as Key Fields. Key Fields cannot be selected as Comparison Fields and vice versa. • Results File - You can either browse and select or specify the path and name of a csv file (only csv files are supported) where the output of fuzzy matching (result and duplicates) are stored. You can use macros for filenames. Matching Tab - Allows you to configure string comparison rules and set the match score cutoff. Click • Field Name - Select a field whose values are compared with each other using the algorithm specified in Comparison Type. This list includes only string fields and those which are not used as Key Fields on the Grouping tab. Note: Only records within the group are compared with each other. • Comparison Type - A list of supported string matching algorithms/functions. For more information, see Remarks. • Weight - Weightage given to the rule which helps to calculate the final score. Default is 1 (same weightage). Allowed range is 1 to 100. If same value is assigned to all rules, they will have same weightage. For example, rule1 - 30, rule2 - 30, rule3 - 30 will have same weightage. |
• Match Score Filter - Select a decimal values between 0.01 to 1. Comparison score is between 0 to 1. Records with comparison score less than this value are not considered a match for probable duplicates and are discarded. The higher the value you select, more strict is the matching. On the Statistics tab, the results for the Duplicate Clusters rule will include: • Number of duplicates - Duplicate row count that was found in the data. • Number of clusters - Duplicate clusters (groups) that were found. Also, there will be option to browse the data written to the Results File. | |
Supported Data Types | Keys can be of any datatype but Rules must be string fields. |
Remarks | Supported Fuzzy Matching algorithms: • CONTAINS: Checks the small string in the long string. • DAMERAU–LEVENSHTEIN: This distance between two strings is the minimum number of operations (insertions, deletions or substitutions of a single character, or transposition of two adjacent characters) required to change one string into another. For more information, see Damerau–Levenshtein distance. • EXACT MATCH: Checks two strings for exact match. • JARO: A measure of characters in common, being no more than half the length of the longer string in distance with consideration for transpositions. • JARO-WINKLER: This algorithm extends Jaro algorithm and uses a prefix scale “p” which gives more favorable ratings to strings that match from the beginning for a set prefix length “l”. The prefix length is set to 4 characters (the maximum possible prefix length). For more information, see Jaro–Winkler distance. • LEVENSHTEIN: This distance between two strings is the minimum number of single-character edits (insertions, deletions or substitutions) required to change one string into other. For more information, see Levenshtein distance. • POSITIONAL QGRAM: Positional q-grams is an extension to q-grams with an additional property called maxDistance used in calculating the string similarity. For example, ‘peter’ contains the positional bigrams (‘pe’,0), (‘et’,1), (‘te’,2) and (‘er’,3). If maxDistance is set to 1, then (‘et’,1) will only be matched to bi-grams in the other string with positions 0 to 2 • QGRAM: q-grams (also called as n-grams) is the process of breaking up a string into multiple strings each with length n (q). For example, apply q-grams on abcde with q = 3 would yield abc, bcd, cde. For example, the word ‘peter’ with q=2 would yield following bigrams - ‘pe’, ‘et’, ‘te’ and ‘er’. A q-gram similarity measure between two strings is calculated by counting the number of q-grams in common. • SHORTHAND: Determine if the shorter string is a “shorthand” of the longer. That is, if it can be produced only by deletions. If the first character of a word in the longer string is deleted, the entire word is considered deleted. For e.g. IBM is a shorthand of International Business Machines. Note: In the edit mode, Metric Type dropdown remains disabled for Duplicate Clusters rule and you can only change the parameters. |
Statistics
Description | Calculates the following statistics for a numeric field. Min, Max, Mean, Median, Mode, Standard Deviation, Sum, Variance. |
Parameters | • Maximum - Calculates the maximum value of a field • Minimum - Calculates the minimum value of a field • Median - Calculates the median (middle of a sorted list) value of the field. • Mode - Calculates the mode (most frequently occurring value) of the field. • Standard Deviation - Estimates standard deviation, a measure of how widely the values are separated from the average value (the mean). • Sum - Calculate the sum of a field. • Variance - Indicates how possible values are spread around the expected value. Numeric data types include all the above rule. However, the string data types include only maximum, minimum, median, and mode. |
Supported Data Types | String, Date, Timestamp, Boolean, Numeric, Double, Float, Long, Integer |
Remarks | This rule allows you to include several summary rule at once instead of adding one rule at a time. |
Equal Range Binning
Description | Constructs a histogram and defines an equal range for each bin. |
Parameters | Top How Many: Calculates equal width ranges across the field values and counts the number of values in each range. RangeCount: Specify the number of ranges to create. The default is 10. The Equal Range Binning rule allows you to set certain parameters to control the histogram output. See the following for examples of the histogram output for each parameter. Consider All Data (default) In this parameter, you set no minimum or maximum values. Therefore, the graphic output may include one bin that contains nearly all the values while the other bins include only a few values. 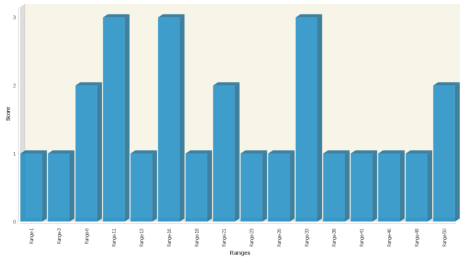 |
Supported Data Types | All numeric types supported as input: • Numeric • Double • Float • Long • Integer |
Remarks | This rule constructs a histogram and defines an equal range for each bin. The rule algorithm works as follows: • Finds the lowest and highest values in the field to profile to determine the end points • Creates Range Count equal-width ranges between highest and lowest values • Counts the non-null values in each range The generated histogram has a Range Count and one bar for nulls. Exceptions: If min and max values are identical, then bar is generated. If data type is integer or long and the minimum and maximum are close together, then it generates the number of bars that fits in the graph. Example: If minimum is 1 and maximum is 4, then rangeCount > = 4 results in one bar for each possible nonnull whole value. The behaviour for interpolated breaks between ranges depends upon the input data type: • int and long: interpolated breaks are whole numbers. • float and double: interpolated breaks are double precision floating point values and can be values such as 1.6799999999999999995 due to floating-point roundoff error. • numeric: interpolated breaks are rounded for presentation. The scale used when rounding is the scale of the minimum or maximum value (whichever is larger), plus a number of digits equal to the number of digits in the rangeCount.. |
Maximum
Description | Calculates the maximum value of a field and supports String types as a separate rule. However, Numeric, Double, Float, Long, and Integer data types are included as part of the Statistics rule. |
Parameters | None |
Supported Data Types | String, Date, Timestamp, Boolean, Numeric, Double, Float, Long, Integer |
Remarks | None |
Median
Description | Calculates the median (middle of a sorted list) value of the field. |
Parameters | None |
Supported Data Types | String, Date, Timestamp, Boolean, Numeric, Double, Float, Long, Integer |
Remarks | None |
Mode
Description | Calculates the mode (most frequently occurring value) of the field. |
Parameters | None |
Supported Data Types | String, Date, Timestamp, Boolean, Numeric, Double, Float, Long, Integer |
Remarks | None |
Most Frequent Values
Description | Calculates the most frequent values of a field. |
Parameters | Type a value in the Top How Many text box for the number of frequent values. The default is 25, which returns the top 25 most frequent values. |
Supported Data Types | String, Date, Timestamp, Boolean, Numeric, Double, Float, Long, Integer |
Remarks | This rule replaces some of the functionality of the Distinct Values rule. |
Standard Deviation
Description | Estimates standard deviation, a measure of how widely values are dispersed from the average value (the mean). |
Parameters | None |
Supported Data Types | String, Date, Timestamp, Boolean, Numeric, Double, Float, Long, Integer |
Remarks | Standard deviation equals the square root of the variance. |
Sum
Description | Calculate the sum of a field. |
Parameters | None |
Supported Data Types | All numeric types supported as input: • Numeric • Double • Float • Long • Integer |
Remarks | None |
Variance
Description | Indicates how possible values are spread around the expected value. |
Parameters | None |
Supported Data Types | All numeric types supported as input: • Numeric • Double • Float • Long • Integer |
Remarks | The square root of the variance equals the standard deviation. |
Last modified date: 01/03/2025