Toolbars
The toolbars at the top of the window provide an alternate means of accessing various functionalities. Items that appear on the toolbars differ depending on the active perspective.
Tip... You can hover over each toolbar item to view its description.
The following table provides information about the available toolbars.
Toolbar | Description |
|---|---|
Common toolbar | Contains icons for common tasks. For information to manage projects and artifacts, see Managing Workspaces, Projects, and Integration Artifacts.  • Create new projects, artifacts or folders • Save current file • Save all files • Search artifacts • Open contextual help |
Perspective toolbar | Allows you to change perspective. For more information about perspectives, see Actian DataConnect Perspectives. 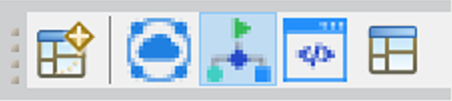 • Open perspective • DataConnect perspective • Process perspective • EZscript Library perspective • EZscript perspective |
Quick Access | Click this icon to open a dialog box that provides you a text field where you can type in a search text to quickly locate available actions for the active editor.  |
Map toolbar | Contains icons for managing map execution. For more information about maps, see Designing and Executing Map.  • Validate map • Run map • Stop map execution |
Process toolbar | Contains icons for managing processes. For more information about process, see Designing and Executing Processes.  • Validate process • Run process • Stop process execution • Search artifacts • Open contextual help • Navigate to next edit location • Zoom-in • Zoom-out • Enable grid view • Snap to geometry |
Profile toolbar | Contains icons for managing a data profile. For more information about data profiles, see Designing and Executing Data Profile.  • Validate Profile • Run Profile • Stop Profile Execution |
Schema toolbar | Contains icons for managing schemas. For more information about schema, see Managing Schemas.  • Update a structured schema • Stop execution |
Debug toolbar | Contains icons for managing a debugging process. For more information about debugging, see Script Debugging.  • Start the debugging process • Stop the debug process • Skip all breakpoints • Resume • Step over • Step into • Stop and restart the debugging process from the beginning |
EZscript Library | Contains icons to manage EZcript operations.For information about the EZscript Library, see Scripting.  • Validate Script • Cut expressions (Ctrl + X) • Copy expressions (Ctrl + C) • Paste expressions (Ctrl + V) • Find and Replace (Ctrl + F) • Undo action (Ctrl + Z) • Redo action (Ctrl + Y) • Add operator • Content assist (Ctrl + Space) • Bookmarks • EZscript preferences |
Last modified date: 06/30/2025