Debug Tab
As soon as you start Debugging, a Debug tab at the bottom of the window gets focus and the debugger starts executing your code.
The Debug tab has the following sections:
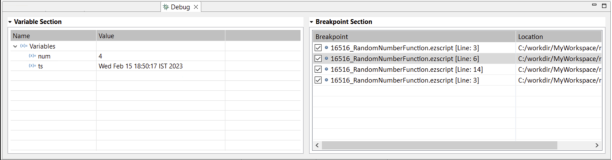
Variable Section - The Variable Section allows you to see the values of all the in context variables, objects, and macros while debugging a script. During the debugging session, you can verify the values from this pane.
Note: The values of encrypted macros are never displayed.
Breakpoints Section - The Breakpoints Section allows you to see all the breakpoints you have set. Breakpoints are used if you want to suspend the execution at some particular line and inspect the variables closely. You can attach a breakpoint to any line or remove it by double-clicking left of the line number. A blue dot will appear when a breakpoint has been defined for that line. The next time when you debug, you can see that the program suspends the execution at the line and waits for your command. You can now use the Debug Toolbar to navigate along with your code. See Debug Toolbar and Menu Options
Tip...
- Use the checkbox that is displayed against a breakpoint to enable or disable the breakpoint.
- Double-click a breakpoint in the Breakpoint Section to open the source script file. Each script file is displayed in a separate script tab.
- Select a breakpoint in the Breakpoint Section and press Delete to delete the breakpoint.
Last modified date: 06/30/2025