Iteration and Time Histogram Tabs
Engine Profiler displays the following two histogram tabs:
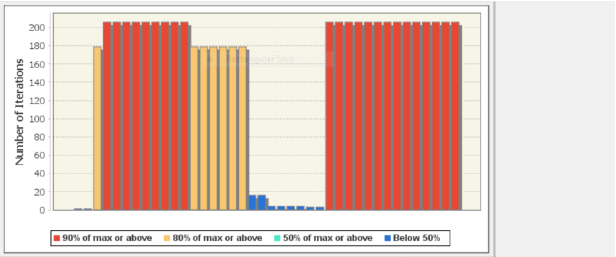
• Iteration Histogram: Displays the number of iterations or calls for nodes and code lines
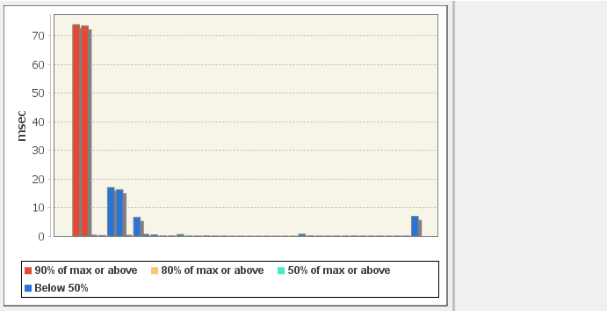
• Time Histogram: Displays execution times for nodes and code lines
The bar chart are displayed according to the Statistics tab results and the bar information matches with the Statistics tab results.Executions times are inclusive; if a user-defined function calls another function, the called function time is included in the time displayed for the calling function.
The following image is an example of an iteration histogram.

The following image is an example of a time histogram.

When you mouse over each node, the caption at the bottom changes to describe the node. Colors indicate the item ranking for the histogram points.
Color | Item Ranking |
|---|---|
Red | 90% of maximum or above |
Orange | 80% of maximum or above |
Green | 50% of maximum or above |
Blue | Remaining % to equal 100% |
Note: When you hover over any bar in the chart, the tooltip is displayed. If you resize the panel and then if you hover over any bar in the chart, the tooltip is not displayed. When you resize any panel, it affects the profile size. Due to this, the tooltip does not display.
To resolve this, click anywhere on the chart to have it in focus and then hover over the bar to view the tooltip.
To resolve this, click anywhere on the chart to have it in focus and then hover over the bar to view the tooltip.
Click on any of the following bar of the chart, the respective tab of the .out file is displayed.
Bar Name | Displayed Tab |
|---|---|
Module bar | Statistics tab displays the selected module |
Instance | Call graph tab displays the updated pie chart for Called node. |
Transformation | Call graph tab displays the updated pie charts for both Callers and Called nodes. |
Event | Call graph tab displays the updated pie charts for both Callers and Called nodes. |
Event Action | Call graph tab displays the updated pie charts for both Callers and Called nodes. |
Function(Pre/User defined) | Call graph tab displays the updated pie charts for both Callers and Called nodes. |
Last modified date: 06/30/2025