Exploring the Data Profile Editor
The Data Profile Editor is the main working area for creating and managing your data profile (.dq and .dq.rtc) files. When you create or open a data profile file, it opens in this editor.
Note: The Data Profiler .dp artifact is not supported in DataConnect 12.5 and therefore cannot be opened for editing. It has been replaced by a .dq (Data Quality) file and a .dq.rtc (Runtime Config) file. Please recreate the profile as .dq and .dq.rtc artifacts. You can right-click on the .dp file to view profile content in a JSON editor. Also note that some rules have been deprecated or replaced with new rules. For more information, see Deprecated Rules.
The following is a sample image of the Data Profile Editor.
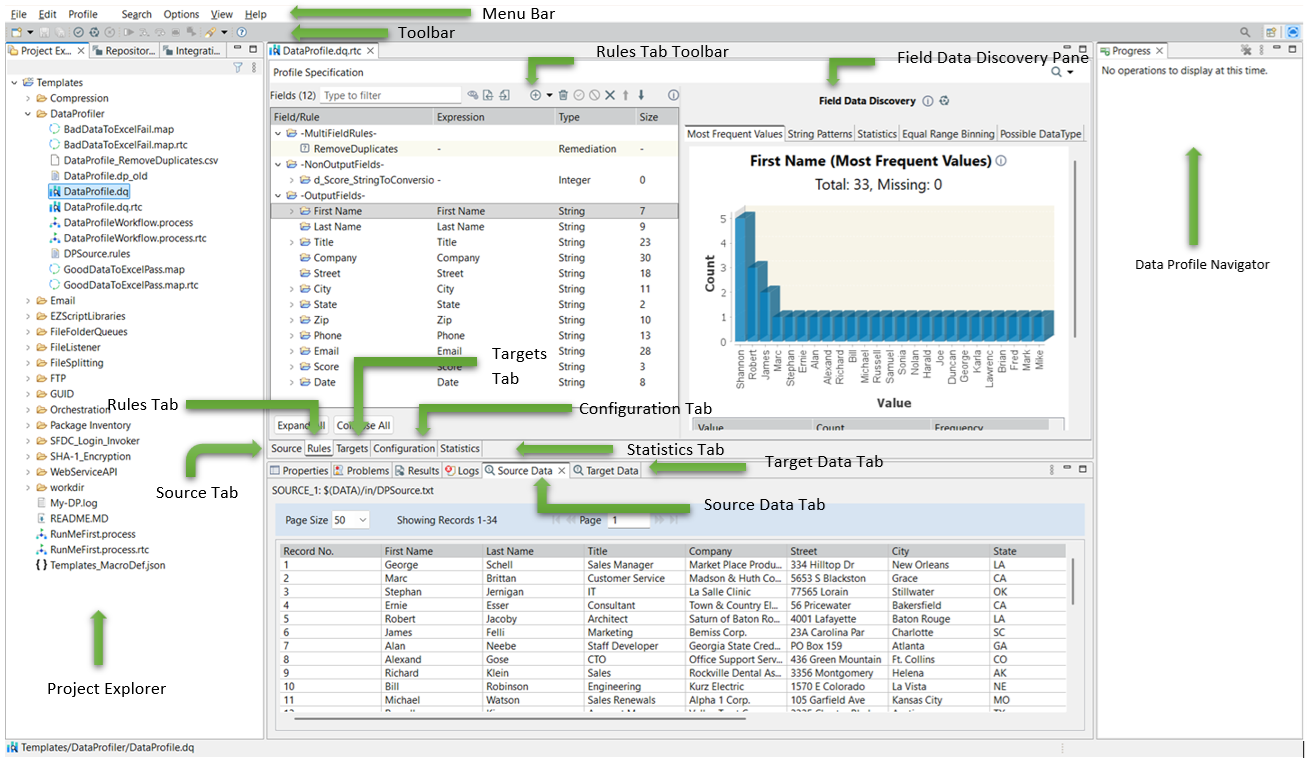
It includes the following main areas:
• Project Explorer: Displays folders, projects, and artifacts within a workspace in a tree view. You cannot reorder or sort the items in this view. Double-click the file to open the artifact.
• Source Tab: You can manage the source connection and schema information from this tab. It also allows you to define sort and sample data. For more information, see Specifying the Source Connection for Data Profile.
• Rules Tab: The Rules tab displays fields and their associated rules in a tree view, with each rule organized under its corresponding field. You can manage the data quality rules to be applied to source fields from this tab. For more information, see Adding Rules from Rules Tab. You can also add and remove fields to/from your output. See Add Source/Derived Fields to Output.
• Targets Tab: You can manage the target connection and schema information from this tab. For more information, see Understanding and Specifying Data Profile Targets.
• Configuration Tab: You can manage logging options, macros, and Add New Rule. For more information, see Configuring Data Profile.
• Statistics Tab: Displays overall execution results, rule-specific pass/fail statistics, and Add New Rule (if configured). For information, see Validating and Running Profile.
• Source Data Tab: Displays the Source data in table format with column headings as Record Name, Field1, Field2, Field3, and so on. For more information, see Browsing Source Data.
• Target Data Tab: Displays the Target data in table format with column headings as Record Name, Field1, Field2, Field3, and so on. For more information, see Browsing Target Data.
• Field Data Discovery Pane: Select a field name to view Field Data Discovery in the right pane. For more information, see Field Data Discovery. If no field is selected, or if you are not connected to the source, Field Data Discovery results are not displayed.
• Rules Tab Toolbar: The toolbar that is displayed on the Rules tab, provides a means of managing rules and fields. For a complete list of toolbar icons, see the toolbar descriptions in the Rules Tab.
Last modified date: 05/27/2026