Application Performance
DataFlow provides the ability to collect statistics about the execution of a graph. Being part of the execution process provides useful advantages over the other approaches described previously. For one, the data collected is tied directly to the operators and flows within the graph, making it easier to understand the connection between the graph and its performance. In addition, it is also aware of distributed execution, providing a single place to get information about a distributed graph that is executing.
By default, monitoring of graph execution is not enabled. There are different ways of enabling monitoring, based on how monitoring will be done. The simplest (and preferred) method is using the Dataflow SDK plugin for Eclipse. This plugin can be used to develop and profile DataFlow applications. The Installing and Configuring the DataFlow Plugin to Eclipse IDE topic discusses how to install and configure the plugin for DataFlow application development. After it has been configured and an application developed, the Eclipse environment can be used to profile Dataflow applications.
An alternative is to directly monitor a graph through the monitoring API in DataFlow. This might be used in situations where DataFlow is embedded in a larger application and greater flexibility in reporting is required.
Remote Monitoring
Using the DataFlow plugin to profile running applications is called remote monitoring. There are two ways to enable remote monitoring:
• Set system properties on the JVM command line. This is the most flexible since you do not have to modify your code to explicitly set the engine configuration.
• Set engine configuration settings within your application. This requires modifying your code but will work in any environment.
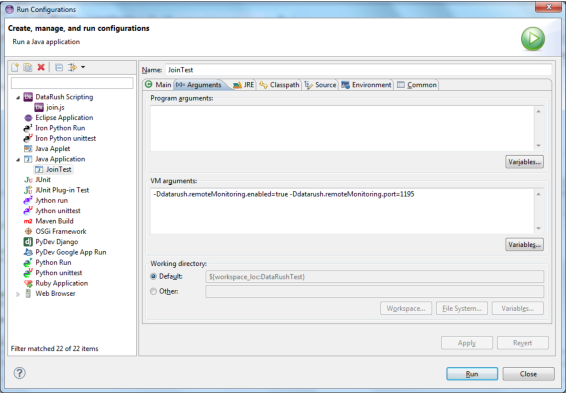
Setting the system properties can be accomplished in Eclipse by creating a launch configuration. The easiest way to do this within Eclipse is to right-click on your application class in the Package Explorer and select the "Run as ..." menu item.
If you select to launch the application as a Java application, Eclipse will set up a default launch configuration for you. Otherwise, select "Run Configurations ..." and build a new "Java Application" launcher for your application.
To set the needed system properties, select the "Arguments" tab and within the "VM Arguments" space, set the dataflow.remoteMonitoring.enable value to true and the dataflow.remoteMonitoring.port value to a valid port. Port 1195 is the default. The following screen shot shows setting up the required system properties in a launch configuration.

Remote monitoring can also be enabled by setting the needed engine configuration settings within your code. Following is an example snippet of code that sets the remote monitoring settings directly.
Setting remote monitoring engine configuration
EngineConfig config = EngineConfig.engine();
config = config.remoteMonitoring.enabled(true);
config = config.remoteMonitoring.port(1195);
graph.compile(config).run();
config = config.remoteMonitoring.enabled(true);
config = config.remoteMonitoring.port(1195);
graph.compile(config).run();
Before profiling the application, a profiling configuration is needed. Open the debug configurations by selecting the debug icon and then the "Debug Configurations" menu item. Create a new "Remote Dataflow Monitoring" configuration. The host name defaults to localhost and the port defaults to 1195. Change these values as needed.
To profile the Dataflow application, first launch the "Remote Dataflow Monitoring" configuration. This will start a monitor that will attempt to connect to the configured host and port. The perspective will be changed to the debug perspective. Launch the Dataflow application configured earlier with the system properties enabling remote monitoring. The application launched will now be profiled. Two views will be updated:
• Graph Execution View
• Graph Execution Details
The Graph Execution View window provides a diagram of the DataFlow application being profiled. The snapshot below was captured while profiling the sample application used in the debugging section above. The diagram depicts the application that was composed with the composition API: a file reader for ratings, a file reader for movies, join, group, and write. This view can be used to visually verify composition of an application.

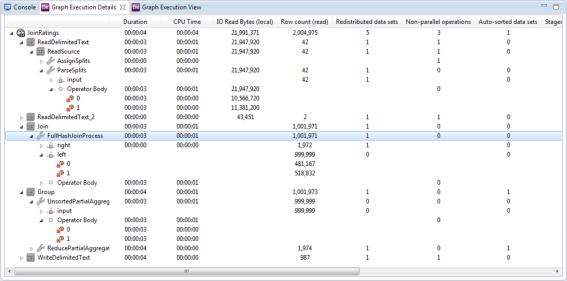
The Graph Execution Details window provides runtime information for each operator in the graph. The graph is displayed as a hierarchy, permitting drill down into sub-operators of composite operators and individual streams of execution for executable operators. This level of detail allows insight not only into the logical application, but also the physical plan generated by the DataFlow compiler. Information available includes such things as:
• How much time, both wall clock and CPU, the operator spent executing
• How many rows of data were processed by each operator on each input
• How many bytes were read and written to different file system types
• Where in the logical graph the framework injected redistribution, sorting, and staging of data
This view can provide critical hints for understanding application performance. Are only a few streams of execution handling most of the data? Then potential parallelism may be being wasted. Does one operator consume a much greater amount of CPU than others? Then that operator may be a candidate for a more efficient implementation. Are there unexpected sorts or redistributions being done? Are there unexpected non-parallel operations? Then perhaps provided metadata is insufficient, and adding hints or restructuring the graph may help.
A snapshot of execution details is shown below with some of the nodes in the hierarchy expanded to reveal lower levels of detail. Looking at the details, there are a few items of note. First, we see the reading and parsing of the movie data is parallelized (though an initial portion of non-parallel processing also occurs). Roughly the same amount of data is read by each partition. This data then is fed into the Join operator. This is a hash join as evidenced by the sub-operator FullHashJoinProcess, so the right input is redistributed so that all streams will have a full copy, and the left side is not redistributed at all.
The two partitions on the left input are roughly balanced, one reading around 481,167 rows and the other 518,832 rows. These results in turn are fed into the Group operator, consisting of two sub-operators: UnsortedPartialAggregator and ReducePartialAggregates. The statistics show a redistribution and sort being performed between the two sub-operators as partial aggregation results are exchanged between streams to combine into final results. These results are then written to a single file with the write being a non-parallel operation, as would be expected. Overall, the sample application ran very quickly showing negligible run times for all of the operators.

Monitoring API
The same run time information available to DataFlow remote monitoring is available when executing an embedded DataFlow application. The LogicalGraphInstance created by compiling and starting a DataFlow application can be used to capture run time information. The following code example demonstrates the steps of creating a DataFlow application, starting it, and monitoring its execution until the application completes.
Monitoring an embedded application
import java.util.List;
import com.pervasive.datarush.graphs.EngineConfig;
import com.pervasive.datarush.graphs.InputPortInstance;
import com.pervasive.datarush.graphs.LogicalGraph;
import com.pervasive.datarush.graphs.LogicalGraphFactory;
import com.pervasive.datarush.graphs.LogicalGraphInstance;
import com.pervasive.datarush.graphs.LogicalStatistic;
import com.pervasive.datarush.graphs.OperatorInstance;
import com.pervasive.datarush.operators.LogicalOperator;
import com.pervasive.datarush.operators.sink.LogRows;
import com.pervasive.datarush.operators.source.GenerateRandom;
import com.pervasive.datarush.ports.LogicalPort;
import com.pervasive.datarush.types.RecordTokenType;
import com.pervasive.datarush.types.TokenTypeConstant;
/**
* Create a simple application graph consisting of a random row generator and
* a row logger. Execute the graph with the default engine properties.
*
*/
public class MonitoringAppInstance {
public static void main(String[] args) {
// Create an empty logical graph
LogicalGraph graph = LogicalGraphFactory.newLogicalGraph("SimpleApp");
// Create a random row generator setting the row count and type wanted
GenerateRandom generator = graph.add(new GenerateRandom(), "generator");
generator.setRowCount(100000000);
RecordTokenType type = TokenTypeConstant.record(
TokenTypeConstant.DOUBLE("dblField"),
TokenTypeConstant.STRING("stringFld"));
generator.setOutputType(type);
// Create a row logger
LogRows logger = graph.add(new LogRows(0), "logger");
// Connect the output of the generator to the input of the logger
graph.connect(generator.getOutput(), logger.getInput());
// Compile the graph with monitoring enabled
LogicalGraphInstance instance = graph.compile(EngineConfig.engine().monitored(true));
// Start the instance. This call is asyncrhonous. It returns right away.
// Use join to wait for graph completion.
instance.start();
// Monitor the graph while it is running.
do {
// Dump stats
dumpOpStats(instance, generator, logger);
dumpCxnStats(instance, logger.getInput());
// Sleep and then check the instance state
try {
Thread.sleep(1000);
}
catch (InterruptedException e) {
break;
}
} while (!instance.getState().isComplete());
dumpOpStats(instance, generator, logger);
dumpCxnStats(instance, logger.getInput());
// Join with the graph instance to clean up
try {
instance.join();
}
catch (InterruptedException e) {
e.printStackTrace();
}
}
private static void dumpOpStats(LogicalGraphInstance graphInstance, LogicalOperator... ops) {
for (LogicalOperator op : ops) {
OperatorInstance opInstance = graphInstance.getOperatorInstance(op);
System.out.println(opInstance.getPath() + ": state: " + opInstance.getState());
dumpStats(opInstance.getStatistics());
}
}
private static void dumpCxnStats(LogicalGraphInstance instance, LogicalPort...ports) {
for (LogicalPort port : ports) {
InputPortInstance portInstance = instance.getPortInstance(port);
dumpStats(portInstance.getStatistics());
}
}
private static void dumpStats(List<LogicalStatistic> stats) {
for (LogicalStatistic stat : stats) {
System.out.println(stat.path() + ": partition "+stat.nodeID()+ ": "+stat.definition()+": "+stat.supplier());
}
}
}
This simple application is composed of a data generator connected to a row logger. Starting on line 45, the application is compiled. The graph instance returned from the compilation is started asynchronously. This allows the main thread to monitor the application until the application completes. After the application completes, the graph instance is joined with the main thread to finalize the application.
While the application is running, the graph instance is used to query the run time statistics of the operators and operator connections within the graph. Information about each is simply written to the standard output. For operators, the state, total duration, and CPU duration are logged. For the connections, the number of rows processed is logged. A snippet at the end of the output of the application is shown below.
The parallelism for this execution was set to 2. As can be seen, two generator operators executed in parallel. This is also true for the row loggers. A total of 100,000 records were output, and each thread of execution handled 50,000 rows.
SimpleApp.generator: state: COMPLETE_SUCCESS
SimpleApp.generator: duration: 80 ms
SimpleApp.generator: CPU usage: 62 ms
SimpleApp.generator: duration: 78 ms
SimpleApp.generator: CPU usage: 62 ms
SimpleApp.logger: state: COMPLETE_SUCCESS
SimpleApp.logger: duration: 79 ms
SimpleApp.logger: CPU usage: 15 ms
SimpleApp.logger: duration: 72 ms
SimpleApp.logger: CPU usage: 15 ms
SimpleApp.logger.inputs.input: tokens: 50000
SimpleApp.logger.inputs.input: tokens: 50000
The programmatic interface provided by the logical graph easily enables obtaining detailed run time information about an application’s execution.
Last modified date: 01/06/2023