Replication Monitor Window
Tthe Replication Monitor window appears when you select the Monitor option from the Replicator Manager main menu window.
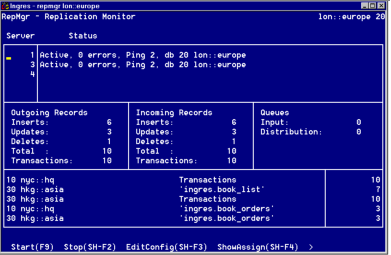
For all active servers, the Replication Monitor window shows the total number of outgoing and incoming records, the total number of transactions associated with the incoming and outgoing records, and queue information for the local database.
Note: You can monitor Ingres Replicator outgoing record counts since a Replicator Server was started by using the command line utility, rsstatd. For more information about the rsstatd command, see the Command Reference Guide.
You can use the Replication Monitor window to:
• Configure servers by setting server flags
• Start and stop a server
• Ping all servers
• View a server’s CDDS and database assignments
• View the status of active servers
• Display the current activity of the servers
• Issue database events to override server flags
Note: The counts of incoming and outgoing records are transient. They show activity only since the time the Replication Monitor was first entered or since the last time that the Clear menu option was chosen. The Replication Monitor window uses the FRS time-out feature to determine when to look for server activity. The monitor does not attempt to retrieve status information until the keyboard has been idle for five seconds.
The Replication Monitor window has the following items:
Server Status Box
A running server is either active or quiet. An active server processes distributed transactions as they are created or received. A quiet server only processes transactions at the request of a dd_go_server database event or periodically when the Event Timeout flag is used.
Initially, if a server is not running, the window does not display a status. If a server does not report back shortly after it has been started, a warning message is displayed. The status is updated when the server is started, in response to a ping or any other database event, and when the server encounters an error. When the server shuts down normally, an appropriate status message is displayed.
Error Count
Number of Level 1 errors (configuration, time-out, transmissions, and fatal errors) the server has encountered. If the number of errors reaches the -EMX startup parameter value, the server shuts down.
Ping
Number of times the server has been pinged. A ping requests all servers to respond with a status message. If this increases the ping number of the server, this indicates the server is running.
Note: You ping a server to determine whether it is running. The server status on the monitor indicates how the server is set up to process transactions, but it does not indicate whether the server is processing those transactions.
Database
The number, virtual node, and name of the database to which the server is connected.
Outgoing Records Box
Number of records that have been processed and transmitted by the servers attached to this source database since you entered the Replication Monitor window. A replicated insert, update, or delete operation that is successfully executed and rolled back is still reflected in the count.
The Transaction field displays the total number of transactions originating from this source database.
Incoming Records Box
Number of records that have arrived at this database from other replicated databases since you entered the Replication Monitor window. A replicated insert, update, or delete operation that is successfully executed and rolled back is still reflected in the count.
The Transaction field displays the total number of transactions executed by remote Replicator Servers against this database.
Note: Fields in the Incoming and Outgoing boxes with zero values are reflected with spaces.
Queues Box
Contains queue information entering the Replication Monitor window and when selecting the Queues operation. When selected, this box displays in the Input and Distribution fields a snapshot count of the records that are currently in the database’s input queue and distribution queue.
Note: This information does not update automatically; it is only updated when you use the Queues operation.
Activity Display Box
The display area under the three boxes breaks down the incoming and outgoing totals in the following formats:
db_no vnode::dbname ‘tablename’ count
and
db_no vnode::dbname Transactions count
In the first format, the tablename field reflects the activity that is occurring on the table of that name. The count field reflects both the incoming records sent to this database from the target indicated in db_no field, as well as the outgoing records sent to the target by tablename from this database.
If the display is in the second format, the count field reflects the number of transactions that the servers on this database have successfully executed on that database. For example:
10 nyc::hq Transactions 10
30 hkg::asia ‘rep_dba.book_list’ 7
In the first line, assume you have run Replicator Manager against database 20. There are 10 transactions that the server on database 20 has successfully executed on database 10.
In the second line, assume you have run Replicator Manager against database 20. There are 7 records with activity on tablename book_list owned by rep_dba that have either been incoming to database 20 from database 30 or outgoing to database 30 from database 20.