12. Using the Query Optimizer
:
Query Execution Plans
:
Graphical QEP
Share this page
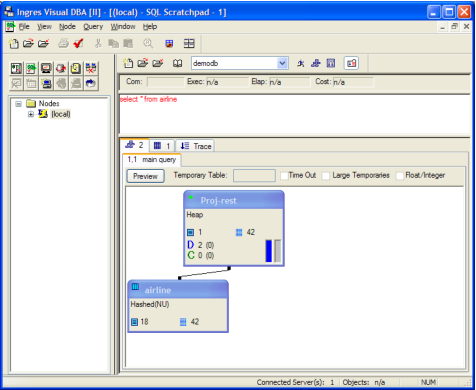
Graphical QEP
In VDBA, QEP diagrams appear in the query information pane as a graph.
For a detailed description of each element in the graph and the meaning of the colors, see Viewing QEP Node Information in online help.