Logging System Header Screen
The Logging System Header screen appears when you select Header from the Log Info Menu screen. This screen displays the current state of the logging system and critical points in the log file.
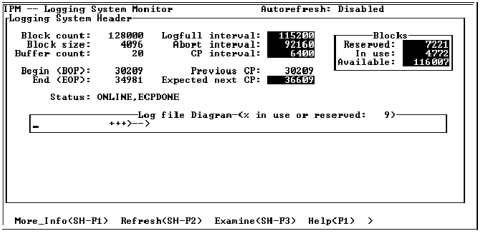
The Log file Diagram displays a logical view of the log file in use. The Log file Diagram starts at page 1 of the log file through the page specified by the Block count field. In the sample screen, the upper end of the diagram represents page 1024. The area of the diagram covered by the arrow (>----->) is the area of the log file in use (in this case from page 12 to 22). As the BOF (beginning of file) and EOF (end of file) move, so does the arrow.
This screen can be displayed during benchmarks, tests, or daily use to help the system administrator determine if the log file is near FORCE_ABORT. The Blocks in use field shows the actual number of blocks in use. If it is greater than the value in the Abort interval field, IPM displays a warning indicator. The same occurs when the Blocks in use exceeds the value in the Logfull interval field. The system administrator can decide to increase the size of the log file if the percentage of the log file in use approaches the Abort interval.
This screen autorefreshes the information if the -r flag was specified at startup or the Display Refresh field on the Option Selection screen was changed to a number between 1 and 999 seconds. For more information, see Option Selection Screen.
Last modified date: 02/09/2026