Replication Monitor Window
Tthe Replication Monitor window appears when you select the Monitor option from the Replicator Manager main menu window.
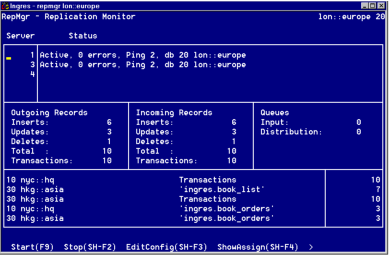
For all active servers, the Replication Monitor window shows the total number of outgoing and incoming records, the total number of transactions associated with the incoming and outgoing records, and queue information for the local database.
Note: You can monitor Ingres Replicator outgoing record counts since a Replicator Server was started by using the command line utility, rsstatd. For more information about the rsstatd command, see the Command Reference Guide.
You can use the Replication Monitor window to:
• Configure servers by setting server flags
• Start and stop a server
• Ping all servers
• View a server’s CDDS and database assignments
• View the status of active servers
• Display the current activity of the servers
• Issue database events to override server flags
Note: The counts of incoming and outgoing records are transient. They show activity only since the time the Replication Monitor was first entered or since the last time that the Clear menu option was chosen. The Replication Monitor window uses the FRS time-out feature to determine when to look for server activity. The monitor does not attempt to retrieve status information until the keyboard has been idle for five seconds.
The Replication Monitor window has the following items:
Server Status Box
A running server is either active or quiet. An active server processes distributed transactions as they are created or received. A quiet server only processes transactions at the request of a dd_go_server database event or periodically when the Event Timeout flag is used.
Initially, if a server is not running, the window does not display a status. If a server does not report back shortly after it has been started, a warning message is displayed. The status is updated when the server is started, in response to a ping or any other database event, and when the server encounters an error. When the server shuts down normally, an appropriate status message is displayed.
Error Count
Number of Level 1 errors (configuration, time-out, transmissions, and fatal errors) the server has encountered. If the number of errors reaches the -EMX startup parameter value, the server shuts down.
Ping
Number of times the server has been pinged. A ping requests all servers to respond with a status message. If this increases the ping number of the server, this indicates the server is running.
Note: You ping a server to determine whether it is running. The server status on the monitor indicates how the server is set up to process transactions, but it does not indicate whether the server is processing those transactions.
Database
The number, virtual node, and name of the database to which the server is connected.
Outgoing Records Box
Number of records that have been processed and transmitted by the servers attached to this source database since you entered the Replication Monitor window. A replicated insert, update, or delete operation that is successfully executed and rolled back is still reflected in the count.
The Transaction field displays the total number of transactions originating from this source database.
Incoming Records Box
Number of records that have arrived at this database from other replicated databases since you entered the Replication Monitor window. A replicated insert, update, or delete operation that is successfully executed and rolled back is still reflected in the count.
The Transaction field displays the total number of transactions executed by remote Replicator Servers against this database.
Note: Fields in the Incoming and Outgoing boxes with zero values are reflected with spaces.
Queues Box
Contains queue information entering the Replication Monitor window and when selecting the Queues operation. When selected, this box displays in the Input and Distribution fields a snapshot count of the records that are currently in the database’s input queue and distribution queue.
Note: This information does not update automatically; it is only updated when you use the Queues operation.
Activity Display Box
The display area under the three boxes breaks down the incoming and outgoing totals in the following formats:
db_no vnode::dbname ‘tablename’ count
and
db_no vnode::dbname Transactions count
In the first format, the tablename field reflects the activity that is occurring on the table of that name. The count field reflects both the incoming records sent to this database from the target indicated in db_no field, as well as the outgoing records sent to the target by tablename from this database.
If the display is in the second format, the count field reflects the number of transactions that the servers on this database have successfully executed on that database. For example:
10 nyc::hq Transactions 10
30 hkg::asia ‘rep_dba.book_list’ 7
30 hkg::asia ‘rep_dba.book_list’ 7
In the first line, assume you have run Replicator Manager against database 20. There are 10 transactions that the server on database 20 has successfully executed on database 10.
In the second line, assume you have run Replicator Manager against database 20. There are 7 records with activity on tablename book_list owned by rep_dba that have either been incoming to database 20 from database 30 or outgoing to database 30 from database 20.
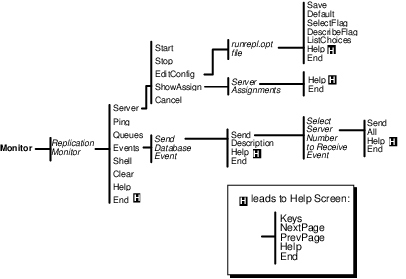
Monitor Menu Map
The following map shows each selection that is accessible from the Replication Monitor.
The menu map uses the following conventions:
Bold typeface—Indicates items selected from boxed list window areas
Regular typeface—Indicates items selected from menu list at the bottom of the window
Italics typeface—Indicates window names
Regular typeface—Indicates items selected from menu list at the bottom of the window
Italics typeface—Indicates window names
Server Assignments Window
The Server Assignments pop-up window appears when you choose ShowAssign from the Replication Monitor window.
This window displays the databases and CDDSs to which the particular Replicator Server transmits.
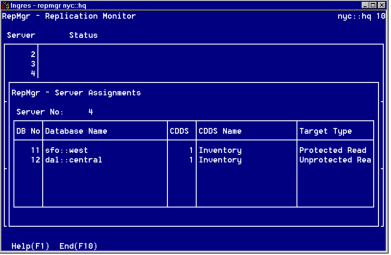
The Server Assignments window has the following fields:
DB No
The number of the database to which the server transmits
Database Name
The database’s virtual node and name
CDDS
The CDDS number to which the server transmits for the listed database
CDDS Name
The CDDS name
Target Type
The target type for the listed CDDS
Edit the Configuration File
To edit a Replicator Server’s configuration file
1. Open the Replication Monitor window, place the cursor on the number of the applicable server, and choose Servers, EditConfig.
The runrepl.opt file pop-up, containing the configuration file for the server and a list of server flags, appears as shown in the following example:
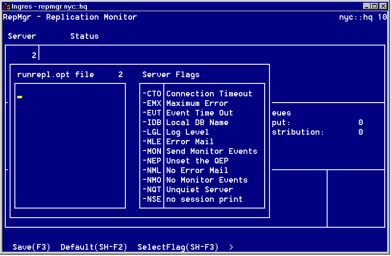
Note: For a brief description of a flag, move the cursor to the flag and choose DescribeFlag.
2. Edit the file using one of these methods:
• Type over existing text.
• Clear previous flag settings, if any, and replace them with the default settings by choosing the Default operation.
• Select flags from the Server Flags list:
a. Move to the Server Flags field.
b. Place the cursor on desired flag.
c. Choose SelectFlag. For certain flags, complete the entry by adding parameters.
3. Choose Save.
The file is saved and you are returned to the Replication Monitor window.
Start a Server
Before you can start a server, you must have configured the server’s configuration file.
To start a server
Open the Replication Monitor window, place the cursor on the number of the server that needs to be started, and choose Server, Start.
A message is displayed indicating that the server is starting.
Within a few seconds, a confirmation message similar to the one below is displayed beside the server number in the Replication Monitor window:
| 2|Active, 0 errors, Ping 1, db 10 nyc::hq |
If the server fails to start after about two minutes, the message, “The Server could not be started” appears instead.
Check the Queues
To check the status of the database input and distribution queues
Open the Replication Monitor window and choose Queues.
Within a few seconds, the Queues box on the Replication Monitor displays current counts of the rows in the input and distribution queues.
Ping Servers
Sending a ping event allows you to check whether the connection to each server is still active.
To ping all running servers
Open the Replication Monitor window and choose Ping.
Within a few seconds, the count on the Ping field of the server status line for each running server must increment by 1. If the count does not increment, the server is not running or is too busy. Each event sent to a server also increments the ping count.
Send Database Event Window
The Send Database Event window is displayed when you choose the Events menu option from the Replication Monitor window, as shown in the following example.
The Send Database Events window lets you do the following:
• Reconfigure a server while it is running by changing its startup flags. For a list of startup flags that can be modified through Replicator Manager, see Server Parameters.
• Issue database events to perform such tasks as shutting down servers or processing pending replications.
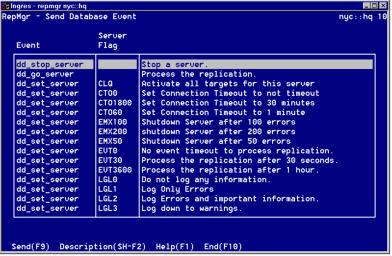
The Send Database Events window has the following fields:
Event
Shows the name of the database event
Server Flag
Shows the parameter value of the database event
Change Server Startup Flags Dynamically
Changing startup flags dynamically on a server overrides the default or the assigned setting for the flag in the server’s configuration file. For a list of configuration flags that you can change dynamically, see Server Parameters. For other methods of sending events to a running server, see Database Events.
To change the parameters of a running server
1. Open the Send Database Event window, highlight the event corresponding to the action you want the server to take, and choose Send.
If no servers are currently running, a message is issued and no pop-up is displayed.
The Select Server Number to Receive Event pop-up appears, as in this example:
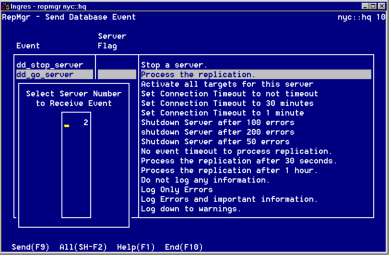
2. Designate the servers that receive the event:
To choose all servers, choose All.
To choose one server, move the cursor to the server number in the Select Server Number to Receive Event window and choose Send.
The message “Event issued” is displayed in the window to confirm that the event was sent.
Stop a Server
To stop a server
Open the Replication Monitor window, highlight the server that needs to be stopped, and choose Servers, Stop.
A database event is sent to the server requesting it to shut down. A message is displayed indicating that the server is stopping.
When the server shuts down, a confirmation message similar to the one below is displayed beside the server number in the Replication Monitor:
| 2|The server has shutdown |
Note: Before a server shuts down, it completes processing any current replicated transaction.
Last modified date: 02/09/2026