Monitor Tab
This tab lets you observe an application as it runs. It displays a schematic of the components in your application while it is running, enabling you to test and improve your application.

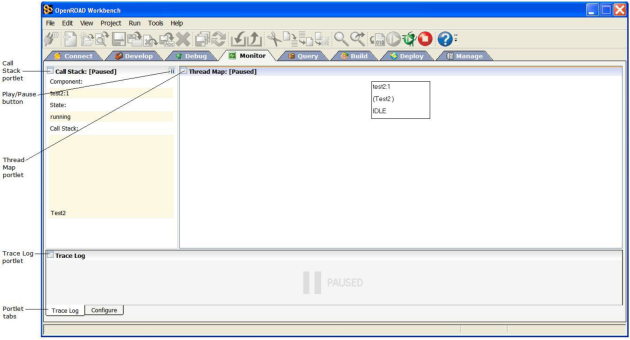
The Monitor tab contains the following portlets:
Call Stack
Displays all calls to procedures, frames, and user class methods. Each thread in an application has a separate call stack.
Thread Map
Displays a dynamic graphical view of the current state of the application, including a tree diagram of the parentage of the various threads in a multi-threaded application
Trace Log
Displays the log file for the running application or component
Trace Configuration
Lets you control what information is logged to the file and redirect the output to an external file
For more information about the Monitor tab, see the chapter "Debugging Your Application" in the Programming Guide.
Last modified date: 12/20/2023