LSQ Function
The LSQ function is based on the linear equation y = mx + c, performs a linear regression analysis for data contained in the xdata and ydata lists, and returns the slope of the line, the intercept of the line, and the correlation coefficient for the line.
Note: Slope, intercept, and correlation must all be passed by reference (byref).
This function has the following syntax:
LSQ(xdata, ydata, byref(slope), byref (intercept), byref(correlation))
Arguments | Data Type | Description |
|---|---|---|
xdata | Array of Object (see following paragraph) | X-axis data points Default: null |
ydata | Array of Object (see following paragraph) | Y-axis data points |
slope | Float | Slope of linear equation Default: null |
intercept | Float | Y-axis intercept of the line Default: null |
correlation | Float | Correlation coefficient Default: null |
The Array of Object can be an Array of FloatObject, IntegerObject, or MoneyObject. If xdata is not included, then the x-axis data points (0, 1, 2, 3 ...) up to the number of y-axis data points are used. A correlation coefficient of 1 is interpreted as being the best case and a 0 is the worst case, with -1 indicating complete reverse correlation.
This function returns:
• ER_OK—No error encountered
• Null—On error
It also returns the following, through optional arguments passed by reference:
• Slope—The slope of the line (m)
• Intercept—The y-axis intercept of the line (c)
• Correlation—A correlation coefficient
Example—LSQ function:
/* Given x-axis values 0,1,2,3,4,5 and y-axis values
** 0,2,6,12,20,30 as data points calculate slope,
** intercept, and correlation coefficient for the
** linear equation that best fits these data points
*/
initialize =
declare
** 0,2,6,12,20,30 as data points calculate slope,
** intercept, and correlation coefficient for the
** linear equation that best fits these data points
*/
initialize =
declare
x = array of FloatObject;
y = array of FloatObject;
status = Integer;
m = Float; /* slope */
c = Float; /* intercept */
co = Float; /* correlation */
j = integer not null;
y = array of FloatObject;
status = Integer;
m = Float; /* slope */
c = Float; /* intercept */
co = Float; /* correlation */
j = integer not null;
begin
for j = 1 to 6 do
x[j].value = j - 1;
y[j].value = j - 1 + (j - 1)**2;
x[j].value = j - 1;
y[j].value = j - 1 + (j - 1)**2;
endfor;
end
on click btn_calc =
begin
begin
status = lsq(xData = x, yData = y,
slope = byref(m),
intercept = byref(c),
correlation = byref(co));
slope = byref(m),
intercept = byref(c),
correlation = byref(co));
if status = ER_OK then
msgbuf = 'slope = ' + text(m) + HC_NEWLINE + 'intercept = ' +
text(c) + HC_NEWLINE + 'correlation = ' + text(co);
message msgbuf;
msgbuf = 'slope = ' + text(m) + HC_NEWLINE + 'intercept = ' +
text(c) + HC_NEWLINE + 'correlation = ' + text(co);
message msgbuf;
else
message 'error calculating lsq';
message 'error calculating lsq';
endif;
end
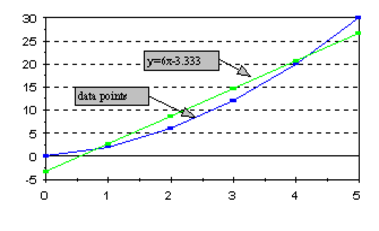
The resulting equation from the values returned from LQS in this example is y = 6x - 3.333 with a correlation of .972. This is shown in the following graph of the data points and the linear equation:

Last modified date: 12/18/2025