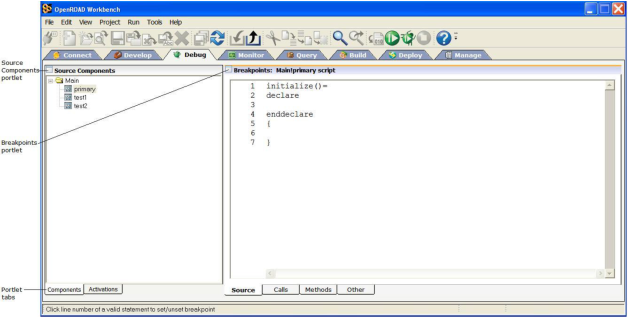
Debug Tab
This tab is where you test and debug the applications you have created on the Develop tab. The Debug tab provides an easy way to set a variety of breakpoints so that you can step through code you have written, line by line.
The Debug tab contains the following portlets:
Source Components
Displays all the source components for the application selected in the Applications portlet of the Develop tab. When you select a component, its source and breakpoints information is displayed in the Breakpoints portlets on the right side of the screen.
For more information, see the chapter "Debugging Your Application" in the Programming Guide.
Activations
Displays the breakpoints that are set in your source and lets you activate or deactivate them without removing them from your source.
Breakpoints: Source
Displays the compiled script for the component selected in the Source Components portlet. This portlet lets you set breakpoints on any executable line of code.
Breakpoints: Calls
Displays a list of user frames and procedures in the application selected in the Source Components portlet. This portlet lets you set breakpoints on specific frames and procedures.
Breakpoints: Methods
Displays a list of user and system classes and their methods for the application selected in the Source Components portlet. This portlet lets you set breakpoints on specific methods.
Breakpoints: Other
Lets you set breakpoints on a variety of events, errors, and threads
For more information about the Debug tab, see the chapter "Debugging Your Application" in the Programming Guide.