Monitoring Database State
You can monitor the state of your database with the Monitor utility. It allows you to oversee the following:
If you are new to Monitor, or want an overview of the utility, see Monitor Overview.
Monitor Overview
Monitor is a utility that allows you to systematically observe certain activities and attributes of the database engine. The utility provides information useful for both database administration and application programming diagnostics. It can monitor aspects of both the MicroKernel Engine and the Relational Engine.
Monitor has two interfaces, both of which provide the same functionality:
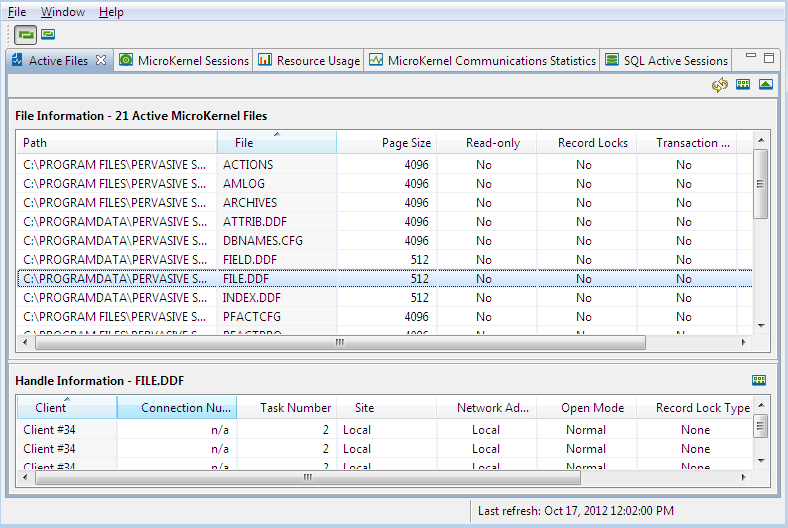
Graphical Interface Monitor presents information in a series of tabs.
Command Line Interface Monitor uses an executable program that directs the information to a selected location.
Graphical Interface Monitor
PCC integrates a Monitor utility that presents information organized into a series of tabs. The tabs can be rearranged for your convenience, with columns of data that can rearranged and sorted. It presents a snapshot of a particular moment and can be refreshed either manually or automatically.
Using GUI Monitor
Within PCC, you access Monitor from PSQL Explorer.
Use one of the following options to open the Monitor window. You can monitor multiple engines at the same time if you choose.
Click Tools > Monitor. A dialog asks you to select a server to monitor.
pcc.exe -monitor_any
A dialog asks you to select a server to monitor.
GUI Features
The table below the following image explains the user interface components. Click any area of the image for which you want more information.
Figure 5 Monitor User Interface
 
Setting Monitor Preferences
You can set preferences for the Monitor from either Monitor itself or from PCC. In either utility, select Window > Preferences > Monitor to open the Monitor tab of the Preferences dialog box.
There are two types of preferences you can set. First, you can set the layout of the Monitor user interface, so that when you reopen Monitor, its tabs are arranged just as you left them. You can set this individually for each server that you access. Second, you can set the features for any particular grid, for example, column width, sort order, and column order. If you open that particular grid on another server, it follows the same settings. That way, you can easily compare the same grid on different servers.
Setting Refresh Options
Information in the Monitor can be refreshed automatically at a configured interval, as desired, or not at all. Be aware that refreshing too many windows at a short interval may slow performance.
1.
Use the Set Automatic Refresh icon to turn on automatic refresh.
2.
Either select File > Set Automatic Refresh Rate or click the Set Refresh Rate icon to open the Set Refresh Rate dialog box.
3.
In the Set Refresh Rate dialog box, enter the number of second between each refresh and click OK.
Either select File > Automatic Refresh or click the Refresh icon.
Use the Set Automatic Refresh icon to turn off automatic refresh.
Tab Functionality
Tabs can be rearranged, separated, and reaggregated for your convenience. To move a tab, put the cursor on the tab label, hold down the left mouse button, and pull the tab label where you want the tab to be.
Because of the different nature of the data on each tab, different operations can be performed on each tab. Those operations are initiated by the icons that appear at the right end of the row of tab labels. The following table describes the icons.
Table 35
Toggles between displaying or hiding the Handle Information grid at the bottom of the tab. The Handle Information grid includes different information, depending on the tab.
The Handle Information grid also has a Select Columns to Display icon, so that you can hide or display columns as desired.
Caution: This procedure actually terminates a session, so you are interrupting someone’s work in progress. Consequently, a message asks you to confirm that you actually want to do this.
Caution: This procedure actually terminates all sessions, so you are interrupting work in progress. Consequently, a message asks you to confirm that you actually want to do this.
Monitoring Active Files
The Active Files tab provides information about MicroKernel files that are currently open. To select columns to monitor, see Select Columns to Display.
 
Monitor uses kilobytes (KB) for the size of an individual file and megabytes (MB) as the units for resource usage (Monitoring Resource Usage). License Administrator uses gigabytes (GB) as the units because that is how data in use is associated with a key. The different contexts require units appropriate for each context.
You can view the handle information for any active file. See Hide/Show Handles. Active file handles include the following information.
Monitor also specifies all open modes as nontransactional or shared locking when applicable.
Monitoring MicroKernel Sessions
The MicroKernel Sessions tab provides information about current connections to the MicroKernel Engine. To select columns to monitor, see Select Columns to Display.
 
Session information reflects the sessions established through the MicroKernel Engine and through the Relational Engine. If you want to view sessions established only through the Relational Engine, see Monitoring SQL Active Sessions.
You can view the handle information for any MicroKernel session. See Hide/Show Handles. MicroKernel session handles include the following information.
 
Monitor also specifies all open modes as nontransactional or shared locking when applicable.
Monitoring Resource Usage
The Resource Usage tab displays the resources in use by the MicroKernel since the engine was last started. To select columns to monitor, see Select Columns to Display.
The database engine dynamically controls the maximum values for some of these resources. The maximum value for User Count, Session Count, and Data In Use depends on the product license. See License Models in PSQL User's Guide.
If a resource does not apply to the type of PSQL product being monitored, “n/a” (“not applicable”) appears for each statistic. For example, User Count does not apply to PSQL Vx Server. Therefore, “n/a” appears as the Current, Peak, and Maximum value for User Count if PSQL Vx Server is being monitored. Similarly, “n/a” appears as the Maximum value for Session Count and Data in Use MB if PSQL Server is being monitored.
If you are considering using PSQL Vx Server, you need the ability to estimate Current and Peak values for Session Count and Data in Use MB. Consequently, those statistics are displayed for PSQL Server without being enforced. No notifications are sent about them regardless of their values.
 
 
The following table lists the types of resources for usage monitoring.
 
Monitoring MicroKernel Communication Statistics
The MicroKernel Communication Statistics tab displays information about communication with the MicroKernel Engine. It includes separate sections for Communications Statistics and Resource Usage Information. Communication statistics are calculated in terms of total number of occurrences processed since the database engine was started.
To select columns to monitor, see Select Columns to Display.
Communications Statistics


Resource Usage Information
Resource usage information provides current, peak, and maximum values for resource occurrences.
 
 
Monitoring SQL Active Sessions
The SQL Active Sessions tab provides information about current connections to the Relational Engine. This tab also allows you to delete a SQL session. See Delete Selected Session. To select columns to monitor, see Select Columns to Display.
 
Command Line Interface Monitor
The command line interface (CLI) version of Monitor provides the same monitoring functionality as the GUI version.
This subsection contains the following topics:
Accessing CLI Monitor
CLI Monitor runs on the Windows, Linux, and OS X platforms supported by PSQL:
On Windows, the executable program is bmon.bat and is installed, by default, in the \bin directory of the PSQL installation directory. See Where are the PSQL files installed? in Getting Started with PSQL.
On Linux and OS X, the executable program name is bmon and is located, by default, in the /usr/local/psql/bin directory. Certain requirements must be met before you can run bmon on Linux or OS X. These requirements are the same as for another Java utility, bcfg. See Requirements for Running bcfg, and Troubleshooting Guide for Running bcfg.
Configuration File
Bmon requires a configuration file to provide its settings. PSQL provides a sample configuration file named monconfig.txt. It is located, by default, in the \bin directory of the PSQL installation directory. See Where are the PSQL files installed? in Getting Started with PSQL.
Refer to the comments in the sample configuration file for the settings that you can configure.
Monitoring Output
Output from Bmon can be directed to the console, a log file, or both. An application could, for example, check for a particular condition from the console or in a log file, then take appropriate action.
The configuration file specifies where to direct the output.
Command Syntax
bmon -f [filepath]config_file [-runonce]
Options
Keyboard Key Response If Runonce Parameter Omitted
The runonce parameter is optional. If omitted, the utility executes the settings in the configuration file, then pauses for the duration of the refresh rate. During the pause, you can send the utility a valid keyboard key response as shown in Bmon Refresh Rates and Keyboard Key Responses.
If the refresh rate is set to zero, the utility pauses indefinitely until it receives a valid keyboard key response. The refreshrate setting in the configuration file specifies how many seconds to pause. By default, refreshrate is set to the minimal allowed value of 5 seconds.
Q (or q) + Enter stops execution of bmon
R (or r) + Enter refreshes the monitoring (runs bmon again)
refreshrate=seconds_to_pause
where seconds_to_pause is a whole number 5 or greater
(pause for seconds_to_pause seconds)
Q (or q) + Enter stops execution of bmon