Monitoring Data File Fragmentation
Over time in a busy database as records are created, updated, or deleted, data can become fragmented, lengthening times for file access and transaction response. This fragmentation differs from file system fragmentation on a hard disk because it occurs within the data file itself. As a developer or DBA, you may know when a file is likely to fragment from heavy use, but in some systems, you may be guessing.
Defragmenter is a utility that helps you solve this problem by finding data fragmentation and enabling you to correct it. Defragmentation rearranges records and rebuilds indexes in data files and removes unused space so that data can be efficiently accessed again. Defragmenting a file does not alter its data in any way, and records can be created, read, updated, or deleted while their files are being defragmented. You can use Defragmenter features during database engine execution with no need for down time or disruption of business operations in most cases.
Opened as a graphical tool in PSQL Control Center, Defragmenter shows data files in use, including their number of reads and writes so that you can quickly find ones under heavy use. To add files or tables to the Watch List tab, select them and then drag-and-drop, click a button, or right-click and choose the command. If you know of Btrieve files in other locations, you can browse to them and add them to be watched as well.
Defragmenter also runs as the dbdefrag utility.
The following topics cover the use of Defragmenter:
See Automatic Defragmentation for information about using Defragmenter in an unattended mode.
Deciding When to Defragment
Defragmenter helps you analyze your data files for statistics that may explain loss of performance. High statistics for file size and percentage fragmented, unused, and not in order can explain loss of database performance. By defragmenting a file or table, you can reduce all four of these numbers, which are explained in more detail under the Watch List topic. Transactions generally run more quickly against a newly compacted, reindexed file, restoring efficiency, capacity, and performance.
Every database is different, so it isn’t possible to make recommendations that apply to everyone. The decision to defragment depends on your knowledge and experience with your own database and its applications. However, some general considerations are worth making:
If you do not see performance improvements after defragmenting, then the problem likely lies elsewhere and requires a different diagnosis and solution.
When Defragmenter Cannot Be Used
In some cases, Defragmenter cannot be used or will be canceled by database activities of higher priority.
Accessing Defragmenter
Defragmenter runs in three ways:
In PSQL Control Center, select Tools > Defragmenter. For details, see Defragmenter GUI.
At a command prompt, run dbdefrag. Note that this differs from defrag, the Microsoft utility for defragmenting Windows file systems. For details, see Command Line Interface Defragmenter.
Defragmenter GUI
The following screen shot shows the Defragmenter GUI. The table after the image describes the GUI objects. Click an area of the image for which you want more information.
 
 
Note: You can cancel all operations from the Defragmenter window even if they were started at a command prompt, and vice versa.
Defragmenter Tab Views
Defragmenter presents database tables, files, and other objects in tabs in the Defragmenter window.
The tabs in the window can be rearranged. See Arranging Tabs.
Files In Use
The Files In Use tab lists items currently or recently opened by the PSQL engine. You can add files shown in this tab to the Watch List tab to monitor, analyze, and defragment. It is best practice to select only files involved in routine database execution, since they are most likely to contribute to performance issues.
In the Files In Use tab, you can sort the list by clicking the Reads/Writes column heading. Sorting the list helps to identify which files are in heaviest use and possibly more fragmented.
Tables
The Tables tab resembles PSQL Explorer, showing nodes for the server where Defragmenter is running. You can add any file shown in this tab to the Watch List tab.
Btrieve Files
The Btrieve Files tab is a file explorer for drives and directories on the file system. In addition to data files, this tab also lists items not involved in routine operations, such as dbnames.cfg and .ddf files. It is possible to add these files to the Watch List tab to analyze and defragment, but unlike data files, attempting to change them while they are in active use returns errors. These metadata objects are at low risk of fragmentation because they generally do not change in a production environment. In the rare case of their needing defragmenting, it can be done during down-time maintenance.
Watch List
Items in the Watch List tab display statistics after an Analyze or Defragment action has been applied.
Note: This statistic is not supported for Btrieve 6.x and 7.x files. You can analyze and successfully defragment these earlier file versions, but no measurements can be shown for these statistics.
Note: In some files, the lowest possible percentage not in order may be higher than zero. Further defragmentation does not decrease this statistic because records in the file are already stored as efficiently as possible.
Details
Under the Watch List tab, a Details pane summarizes the statistics in the Watch List columns, but with some additional information:
Selecting an item in the Watch List tab displays its details. If you select more than one item, details are shown for the first one highlighted.
Setting Defragmenter Preferences
You can set preferences for Defragment from either the utility itself or from PSQL Control Center. In either GUI, select Window > Preferences > PSQL > Defragmenter to open the Defragmenter tab of the Preferences dialog box.
The following table shows the types of preferences you can set and what they do.
Setting Automatic Refresh Interval
Information in Defragmenter can be refreshed automatically at a configured interval. The default is to refresh every 5 seconds. Be aware that refreshing too many files too often may slow performance.
Arranging Tabs
The Defragmenter tabs can be rearranged and separated for your convenience. To move a tab, drag and drop the tab label where you want the tab to be. If the setting to remember window layout is selected in the Defragmenter preferences, your tab arrangement will be kept.
Defragmenter Tasks
This topic provides steps for using features for various tasks in the Defragmenter GUI.
The automatic refresh rate applies to the statistics in the Watch List tab. Refreshing of lists in the other tabs is done manually by clicking the Refresh icon or right-clicking and selecting Refresh.
1
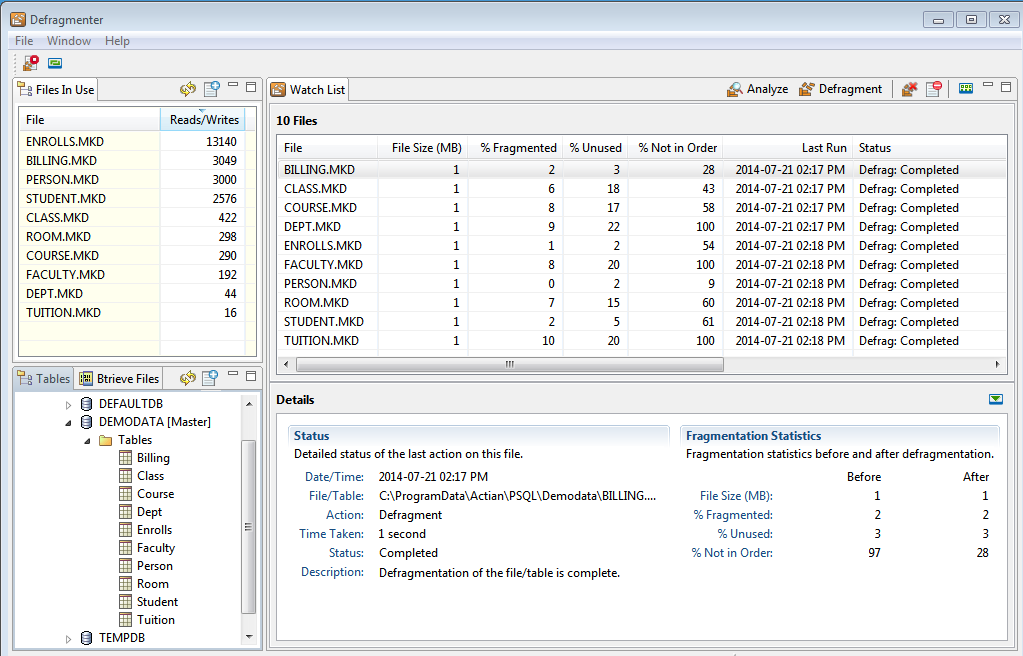
Click File > Set Automatic Refresh Rate or click the Set the Automatic Refresh Rate icon to open the refresh rate dialog box.
2
3
Click OK.
Adding a file or table to the Watch List tab can be done in a number of ways:
Items added to the Watch List tab appear at the end, after the items already there.
Analysis reports statistics that determine which items may need defragmenting.
1
2
The Watch List tab reports analysis results by updating its columns. For the first item selected, the Details tab provides individual status, including the free disk space needed to defragment the file.
1
2
The Watch List tab reports defragmentation results by updating its columns. For each item selected, the Details tab below provides individual status. For multiple selected items, the first one selected is shown.
During analysis or defragmentation, select a file in the Watch List and click the Cancel Defragmentation icon on the right. In the dialog that appears, click Yes to confirm. The Defragmenter operation continues until you click Yes.
Alternatively, you can click the Cancel All Defragmentations icon on the left. This icon stops all analysis and defragmentation activity, while the one on the right is for selected files in the Watch List that are undergoing analysis or defragmentation.
After cancellation, status for some items in the Watch List tab may be Analysis: Completed or Defrag: Completed, with new statistics, while others display Analysis:Canceled or Defrag: Canceled and blank statistics. For a canceled item, the Details tab description gives the time that passed until the moment of cancellation.
Successful cancellation means that analysis was stopped or that fragmentation in the file or table is unchanged.
*Note: You can cancel all operations from the Defragmenter window even if they were started at a command prompt, and vice versa.
1
2
You can set every column in the Watch List tab to be shown or hidden.
1
2
You can toggle to hide or show the Details tab by clicking the Click to Hide Details icon .
Command Line Interface Defragmenter
The CLI utility dbdefrag provides the same functions as its GUI counterpart, except that there is no watch list. Defragmentation actions can be started, checked for status, or canceled from either interface.
The following table gives command line options.
dbdefrag files
Note: You can cancel all operations from the Defragmenter command prompt even if they were started in the Defragmenter GUI window, and vice versa.
Started: yyyy-mm-dd hh:mm:ss
Finished: yyyy-mm-dd hh:mm:ss
Time taken: nh:nnm:nns
n out of n records processed (n%)
n out of n keys processed (n%)
Time taken: nh:nnm:nns
Using dbdefrag
The following example shows a series of steps to demonstrate use of dbdefrag on a large .mkd file.
1
C:\ProgramData\Actian\PSQL\Examples>dbdefrag -analyze mybtrievefile.mkd
  Fragmented: 9%
      Unused: 4%
Not in Order: 100%
   File Size: 713 MB
2
C:\ProgramData\Actian\PSQL\Examples>dbdefrag mybtrievefile.mkd
1125 out of 1195242 records processed (0%)
87021 out of 1195242 records processed (7%)
170910 out of 1195242 records processed (14%)
255393 out of 1195242 records processed (21%)
339805 out of 1195242 records processed (28%)
404202 out of 1195242 records processed (33%)
487928 out of 1195242 records processed (40%)
572585 out of 1195242 records processed (47%)
655802 out of 1195242 records processed (54%)
716472 out of 1195242 records processed (59%)
800406 out of 1195242 records processed (66%)
883729 out of 1195242 records processed (73%)
947475 out of 1195242 records processed (79%)
1032061 out of 1195242 records processed (86%)
1116015 out of 1195242 records processed (93%)
1185831 out of 1195242 records processed (99%)
1195242 out of 1195242 records processed (100%)
1 out of 2 keys processed (50%)
2 out of 2 keys processed (100%)
Defragmentation complete.
Time taken: 0h:24m:57s
3
C:\ProgramData\Actian\PSQL\Examples>dbdefrag -status mybtrievefile.mkd
Defragmentation status: In Progress
1053373 out of 1195242 records processed (88%)
0 out of 2 keys processed (0%)
4
C:\ProgramData\Actian\PSQL\Examples>dbdefrag -status mybtrievefile.mkd
    Status: Complete
   Started: 2014-08-08 11:08:28
  Finished: 2014-08-08 11:33:25
Time taken: 0h:24m:57s
5
C:\ProgramData\Actian\PSQL\Examples>dbdefrag -analyze mybtrievefile.mkd
  Fragmented: 0%
      Unused: 0%
Not in Order: 27%
   File Size: 682 MB