|
•
|
|
Table 50
|
|
See also Waits on Active Writer Lock counter.
|
||
|
See also Waits on Active Reader Lock counter.
|
||
|
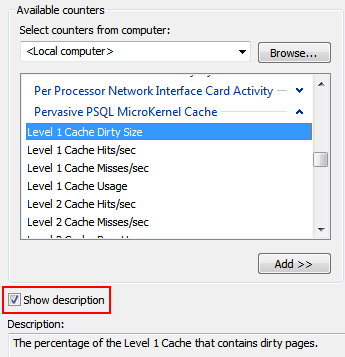
The database engine writes changes to the data files during a system transaction. The frequency in which a system transaction occurs is determined by two server configuration parameters—Initiation Time Limit and Operation Bundle Limit—or triggered by a small amount of free space in the L1 Cache.
|
||
|
To determine the number of application transaction commits. See also End Transaction (20) in Btrieve API Guide.
|
|
1
|
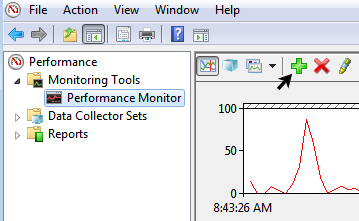
Start Windows Performance Monitor. The steps vary depending on the operating system, but generally the utility can be started from Control Panel --> Administrative Tools. You may also try the command “perfmon” in the Run window (Start --> Run).
|
|
2
|
|
1
|
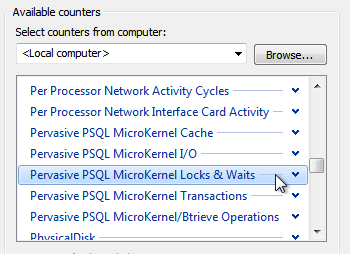
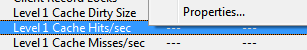
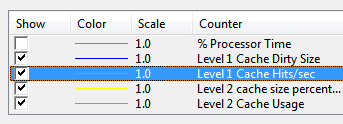
Right-click the desired counter, then click Properties.
|
|
3
|
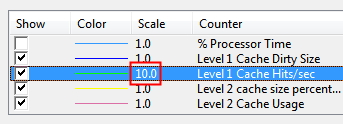
Click OK.
|
|
4
|
|
5
|
Click OK.
|