Capacity Usage Viewer
PCC provides Capacity Usage Viewer to monitor concurrent sessions and data usage for all database engines. This is especially useful when you are considering migrating from PSQL Server to PSQL Vx Server, because of the difference in the way those two editions are licensed. PSQL Server licenses are based on the number of users, while PSQL Vx Server licenses are based on the number of concurrent sessions and the amount of data in use.
Capacity Usage Viewer includes two graphs, one for the number of concurrent sessions and one for the amount of data. Each graph includes a usage level bar, a heavy horizontal line across the graph, to help you determine what volume of usage is normal and what volume is uncommon for your business. The Capacity Usage Viewer also displays peak usage statistics.
The graphs use the peak values that are recorded each day. For any day on which the engine is not used, they use a value of zero. They require a minimum of two days’ data to be generated. Otherwise, Capacity Usage Viewer displays an error message.
In PCC Pervasive PSQL Explorer, right-click the engine you want to examine.
Its context menu opens.
1
Click Capacity Usage Viewer from the context menu.
Capacity Usage Viewer GUI
The following image shows the GUI. The table below the image describes the GUI objects. Click on an area of the image for which you want more information.
Figure 20 Capacity Usage Viewer User Interface
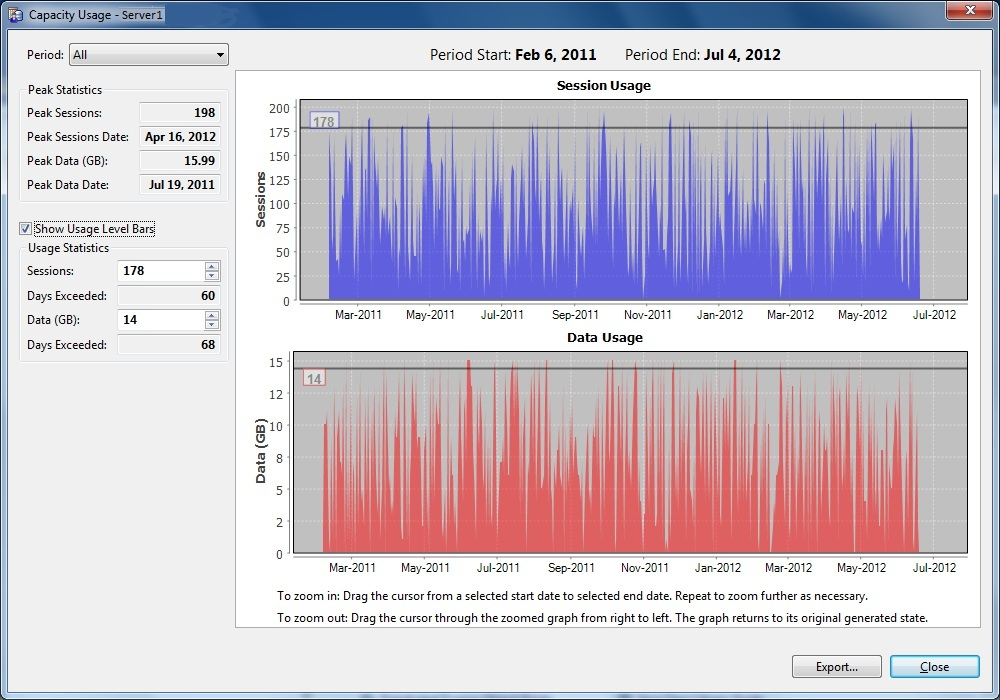
Enables you to export the data to a .CSV file, if you find it useful to save the data for additional analysis. The Export button opens a Browse for Folder dialog, where you can select a location for data storage.
Figure 21 Statistical Indicators
1.
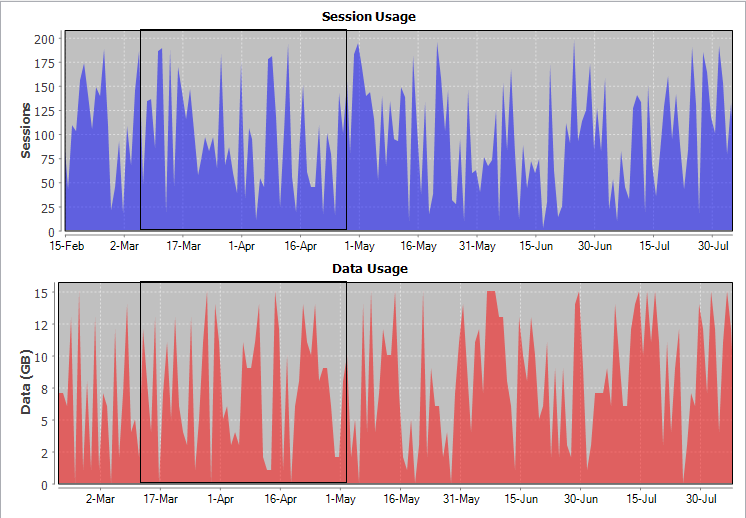
You can also select a time period by zooming the graphs. When you zoom a graph, the Period drop-down menu displays Custom as the selected time period.
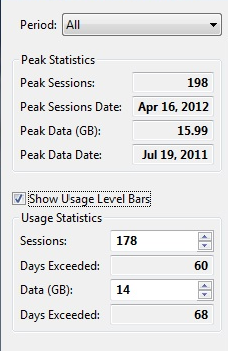
Zooming
If you need to view a particular time period besides the selections provided in the Period pull-down menu, you can select and zoom a segment of a graph. When you zoom one graph, the other zooms simultaneously. The two graphs are always set to the same period.
1
2
 
3
4
5