Monitor
PCC integrates a Monitor utility which allows you to monitor certain activities and attributes of the database engine. The utility can monitor aspects of the MicroKernel Engine and the Relational Engine. It presents information organized into a series of tabs, that can be rearranged for your convenience, with columns of data that can rearranged and sorted. It presents a snapshot of a particular moment and can be refreshed either manually or automatically.
Accessing Monitor
Within PCC, you access Monitor from Pervasive PSQL Explorer.
1
2
3
Click Server Monitor on the context menu.
You can monitor multiple engines at the same time if you choose.
Features of the Monitor User Interface
The table below the following image explains the user interface components. Click any area of the image for which you want more information.
Figure 22 Monitor User Interface
Setting Monitor Preferences
You can set preferences for the Monitor from either Monitor itself or from PCC. In either utility, select Window > Preferences > Monitor to open the Monitor tab of the Preferences dialog box.
There are two types of preferences you can set. First, you can set the layout of the Monitor user interface, so that when you reopen Monitor, its tabs are arranged just as you left them. You can set this individually for each server that you access. Second, you can set the features for any particular grid, for example, column width, sort order, and column order. If you open that particular grid on another server, it follows the same settings. That way, you can easily compare the same grid on different servers.
Setting Refresh Options
Information in the Monitor can be refreshed automatically at a configured interval, as desired, or not at all. Be aware that refreshing too many windows at a short interval may slow performance.
1.
Use the Set Automatic Refresh icon to turn on automatic refresh.
2.
Either select File > Set Automatic Refresh Rate or click the Set Refresh Rate icon to open the Set Refresh Rate dialog box.
3.
In the Set Refresh Rate dialog box, enter the number of second between each refresh and click OK.
Either select File > Automatic Refresh or click the Refresh icon.
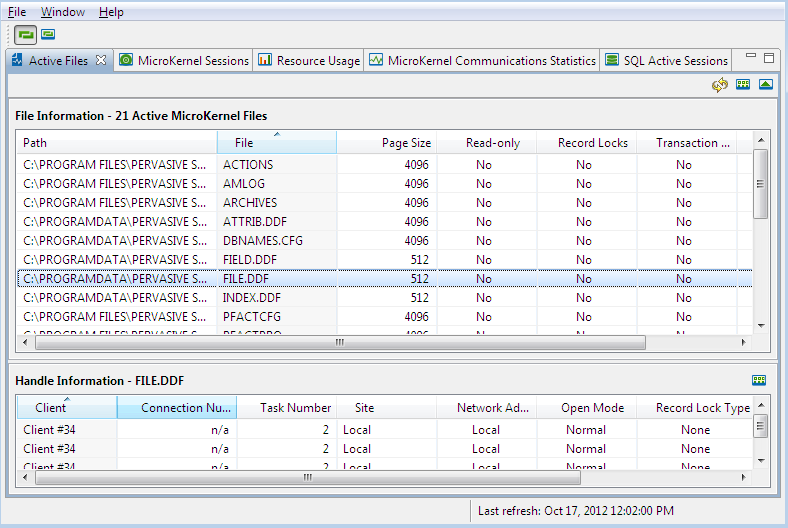
Use the Set Automatic Refresh icon to turn off automatic refresh.
Tab Functionality
Tabs can be rearranged, separated, and reaggregated for your convenience. To move a tab, put the cursor on the tab label, hold down the left mouse button, and pull the tab label where you want the tab to be.
Because of the different nature of the data on each tab, different operations can be performed on each tab. Those operations are initiated by the icons that appear at the right end of the row of tab labels. The following table describes the icons and lists the tabs on which they appear.
Table 9
Toggles between displaying or hiding the Handle Information grid at the bottom of the tab. The Handle Information grid includes different information, depending on the tab.
The Handle Information grid also has a Select Columns to Display icon, so that you can hide or display columns as desired.
Caution: This procedure actually terminates a session, so you are interrupting someone’s work in progress. Consequently, a message asks you to confirm that you actually want to do this.
Caution: This procedure actually terminates all sessions, so you are interrupting work in progress. Consequently, a message asks you to confirm that you actually want to do this.
Monitored Server Activities
The following sections describe the activities displayed on the Monitor tabs:
Active Files
This tab provides information about MicroKernel files that are currently open.
Monitor uses kilobytes (KB) for the size of an individual file and megabytes (MB) as the units for resource usage (Viewing Resource Usage). License Administrator uses gigabytes (GB) as the units because that is how data in use is associated with a key. The different contexts require units appropriate for each context.
You can view the handle information for any active file, if the Hide/Show Handles icon is set to display handles. Active file handles include the following information.
Monitor also specifies all open modes as non-transactional or shared locking when applicable.
MicroKernel Sessions
This tab provides information about current connections to the storage engine.
You can view the handle information for any MicroKernel session, if the Hide/Show Handles icon is set to display handles. MicroKernel session handles include the following information.
Monitor also specifies all open modes as non-transactional or shared locking when applicable.
Resource Usage
This tab shows values for different aspects of MicroKernel operations in progress. In addition to the current values (defined in the following table), the grid on the tab provides peak and maximum values, enabling you to assess resource use and needs. “Peak” is the highest value for the resource since the MicroKernel was started. “Maximum”is the highest allowed value. The following table indicates which resources have unlimited maximum values.
If a file is immediately closed after you insert a large number of records, Monitor does not immediately reflect the changes in file size. For example, the statistics for “Data in Use MB” are not refreshed for that file until the next time the file is opened for reading or writing.
MicroKernel Communication Statistics
This tab displays information about communication with the data storage engine. It includes separate sections for communication statistics and resource usage information.
Communication statistics are calculated in terms of total number of occurrences processed since the database engine was started. “Delta” indicates the number of occurrences since you last accessed the MicroKernel Communications Statistics tab. To restart the count of the delta number, click Reset Deltas.
Resource usage information provides current values, that is, number of occurrences. In addition, for comparison purposes, it provides a peak usage number (the highest number of occurrences for the resource since the MicroKernel was started) and a maximum allowed value. The following table defines the current value for each resource and explains the maximum value when necessary.
SQL Active Sessions
This tab provides information about current connections to the Relational Engine.