Exploring Data Profile Editor
When you create or open a data profile, it opens in a tab called the Data Profile Editor. The following image shows the Data Profile Editor.
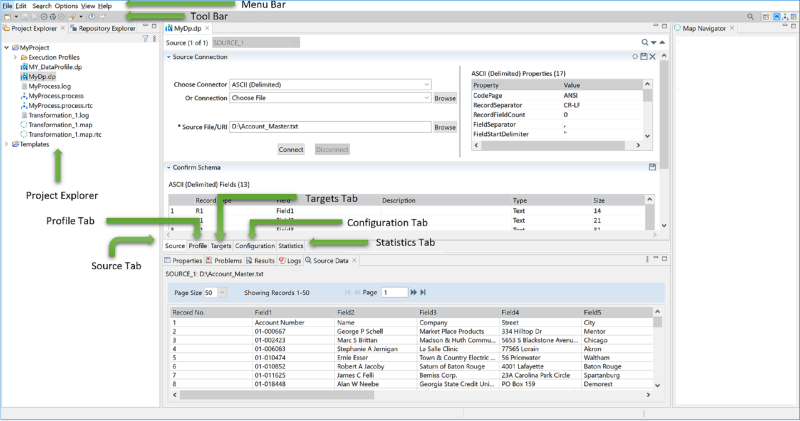
It includes the following main areas:
• Project Explorer: Displays folders, projects, and artifacts within a workspace in a tree view. You cannot reorder or sort the items in this view. Double-click the file to open the artifact.
• Source Tab: You can manage the source connection and schema information from this tab. It also allows you to define sort and sample data. For more information, see Specifying Source Connection for Data Profile.
• Profile Tab: You can manage the data quality rules to be applied to source fields from this tab. For more information, see Specifying Profile.
• Targets Tab: You can manage the target connection and schema information from this tab. For more information, see Specifying Target Connection for Data Profile.
• Configuration Tab: You can manage the logging options and macros from this tab. For more information, see Configuring Data Profile.
• Statistics Tab: Displays both overall and rule specific pass or fail statistics. For information, see Validating and Running Profile.
Last modified date: 01/03/2025