Call Graph Tab
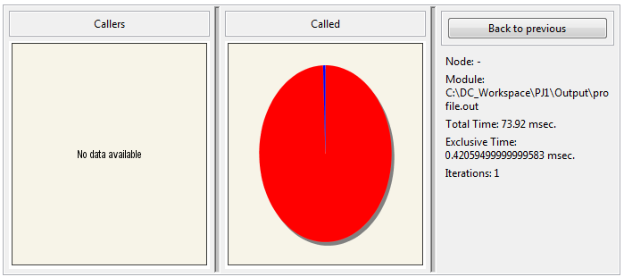
The Call Graph tab provides a graphical display of the Callers and Called nodes for a node. The following image is an example of a call graph.

The left pie chart displays the nodes or lines that call the charted node. The right pie chart displays the nodes called by the charted node.
The following table provides information about the colors that is used to recognize the ranking.
Color | Item Ranking |
|---|---|
Red | 50% of maximum or above |
Orange | 50% of maximum or above |
Other colors | Remaining % to equal 100% |
When you mouse-over the pie chart, the caption for the pie chart changes to display the information for the slice as a tooltip.
Double-click on a section of the pie chart. The related information is displayed under Back to Previous. Click Back to Previous to view the information for the previous section. This is similar to the undo operation.
Note: When you hover over any section in the pie chart, the tooltip is displayed. If you resize the panel and then if you hover over the section in the pie chart, the tooltip is not displayed. When you resize any panel, it affects the profile size. Due to this, the tooltip does not display.
To resolve this, click anywhere on the pie chart to have it in focus and then hover over the section to view the tooltip.
To resolve this, click anywhere on the pie chart to have it in focus and then hover over the section to view the tooltip.
Last modified date: 08/28/2025