The bar_graph Field Template
The bar_graph field template displays the data from one to three data sets in a common bar graph format. The content of the graph is determined completely through the Graph Assistant dialog that serves both the bar_graph and line_graph field templates.
Create a Bar Graph Field
You can create a bar graph field using the bar_graph field template in the Frame Editor.
To create a bar graph field
1. On the Develop tab, in the Components portlet, open the frame in which you want to create the field from the field template.
2. Click Insert, Field From Field Template.
The Select a Field Template dialog appears.
3. Select the core application and the bar_graph template, and then click OK.
4. Position the field on the frame.
Note: The bar graph field is large compared to most frame fields. You should allow generous distances between it and adjacent fields.
The Graph Assistant appears.
5. Complete the dialog using the following information:
Database Name
Identifies the database to which you are currently connected. To change the database, click Change Database. The Change Database dialog appears:
a. To change the host, enter its name in the Host field. Then click Databases to display the available databases on that host.
b. Select one of the databases from the list field (or enter the host name, followed by :: and the database name, for example, new_york::openroad).
c. Set any flag supported by the Connect method for a DBSession object in the Flags field.
d. Click OK.
Use Current
When enabled, specifies the database currently displayed in the Database Name entry field:
Table Types
Specifies the types of tables that you want to select from, including User, DBA, and System
Data Source
Specifies the name of a table or view that will provide the data for the bar graph. Enter the name directly into the field or click the = button for a list of tables to choose from.
Horizontal Axis
Specifies the name of a column within the specified table that will provide data for the graph. Enter the name directly into the field or click the = button for a list of columns from which to choose.
Note: Selecting <auto> causes the horizontal axis to be labeled with sequential numbers starting at the value entered in the Xmin field.
Data Set
Specifies the data sets to be used in the bar graph. You can define up to three data sets. Follow these steps:
1) Select a specific Data Set number by clicking one of the three toggle fields contained within the Data Set box. (Initially Data Set 1 is selected.)
2) In the Data Set box, click the = button next to the Data Set entry field to update the list field with the available data sets (columns), or directly enter the name of the data set to be used into the entry field.
Note: The data sets map to columns from the Data Source table.
3) (Optional) Specify the legend label to be associated with the Data Set in the Legend Label entry field. (If omitted, the column name entered in the Data Set entry field is used as the default.)
Repeat this process for up to three data sets.
Xmin
Specifies the minimum number of rows (on the horizontal axis) to be graphed
Xmax
Specifies the maximum number of rows (on the horizontal axis) to be graphed
Note: The Xmin and Xmax values are used to adjust the number of rows to be graphed. When the Horizontal Axis is chosen, the Xmin and Xmax values for that column are retrieved and displayed in these fields.
Rows
An informational field only, initially displays the total number of rows (records) in a table selected as the data source (in the Data Source field). The number of rows (in the Rows field) is then updated by computing a new count using the criteria “xaxis >= Xmin and xaxis <= Xmax”, where xaxis is the Horizontal Axis column name.
Horizontal Axis Label
Specifies a label to be used for the horizontal axis of your graph.
If omitted, this defaults to the column name specified in the Horizontal Axis entry field.
Vertical Axis Label
Specifies a label to be used for the vertical axis of your graph.
If omitted, this defaults to the table name specified in the Data Source entry field.
Y-Axis
Specifies the high, step, and low values that correspond to values that will be displayed in the graph. For more information about the Y-Axis box, see
How You Can Edit a Bar Graph Field.
Note: The High and Low values can be changed but such changes are not recommended.
6. Click Generate.
The graph is created and displayed in the Frame Editor as various components within a subform.
For more information about how to make changes to the generated bar graph, see
How You Can Edit a Bar Graph Field.
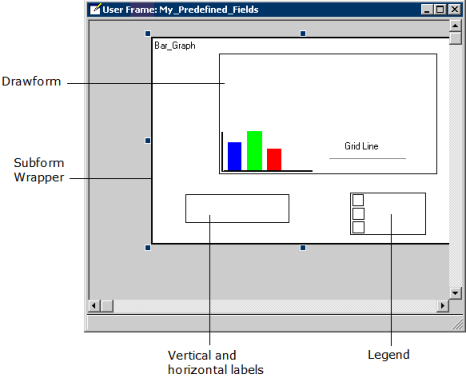
How You Can Edit a Bar Graph Field
The generated bar graph field shown in the following illustration contains three differently shaded rectangle shapes (or three differently shaded lines for the line graph), which represent each of the three possible data sets:
The properties of these rectangles or lines correspond to those of the bars or lines, which represent the data as drawn in the actual graph. These properties are described as follows:
Grid Line Color and Style
The grid line color and style is represented by a segment shape (line),
which is identified by text Grid Line.
Default: solid, gray
Sizing the Display
The size of the display can be modified by adjusting the size of the drawform subform and its parent subform wrapper. The boxes for the vertical and horizontal labels and the legend may require adjustments depending on the length of the text used in them.
Y-Axis Endpoints and Step Interval
In the Graph Assistant, the Y-Axis box lists the high, step, and low values that correspond to values that will be displayed on the graph. The High and Low values may be adjusted for aesthetic and readability considerations.
Y-Axis Labeling
Lets you configure how the y-axis will be scaled and labeled. The available options are:
Auto Size
Specifies that either Zero Base or High Res is dynamically selected at runtime
Zero base
Specifies that zero (0) appears as one of the y-axis tick labels
High res
Provides the effect of zooming in on the data. Generally, the minimum value on the y-axis is slightly less than the data set minimum rather than being zero.
None
Specifies that no adjustments should be made to the labeling range; the actual maximum and minimum of the selected data is used as the endpoints of the y-axis. (This selection is not recommended for bar graphs whose data is all positive or all negative.)
How a Bar Graph Field Is Displayed
Upon executing the frame containing your bar graph field, the field is graphically displayed, using the data you named in the Graph Assistant.