Figure 5 Monitor User Interface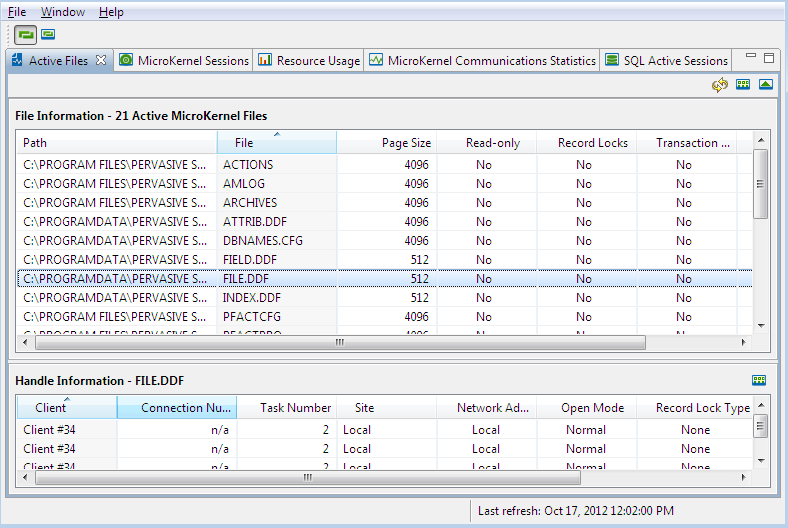
GUI Object | Description | Related Information |
File menu | Allows you to set the refresh rate. | |
Window menu | Allows you to display the database window of the PCC and individual Monitor tabs, and to set preferences. | |
Help menu | Allows you to access the documentation and logs. | |
Tab Set area | Includes five tabs with grids that display information about activity occurring at that moment in the database. When you select a tab, a selection of icons that apply to that tab appear at the right of the row of tab labels. |
Automatic refresh | 1. Use the Set Automatic Refresh icon to turn on automatic refresh. 2. Either select File > Set Automatic Refresh Rate or click the Set Refresh Rate icon to open the Set Refresh Rate dialog box. 3. In the Set Refresh Rate dialog box, enter the number of second between each refresh and click OK. |
Refresh as desired | Either select File > Automatic Refresh or click the Refresh icon. |
No refresh | Use the Set Automatic Refresh icon to turn off automatic refresh. |
Icon | Meaning |
Set Automatic Refresh   | Toggles between automatic refresh on and automatic refresh off. See
Setting Refresh Options. |
Set Refresh Rate  | Displays a dialog box in which you can set the number of seconds between each repopulation of the user interface with current information. See
Setting Refresh Options. |
Refresh  | Repopulates the user interface with the current information. |
Select Columns to Display  | Displays a dialog box in which you can select which columns to display. Because each tab includes different columns, each dialog box includes a different list of column names. All dialog boxes include the choices Select All and Deselect All. |
Hide/Show Handles   | Toggles between displaying or hiding the Handle Information grid at the bottom of the tab. The Handle Information grid includes different information, depending on the tab. The Handle Information grid also has a Select Columns to Display icon, so that you can hide or display columns as desired. |
Delete Selected Session  | Removes a highlighted session from the tab. This icon becomes activated only after a session is selected. Caution: This procedure actually terminates a session, so you are interrupting someone’s work in progress. Consequently, a message asks you to confirm that you actually want to do this. |
Delete All Sessions  | Removes all sessions from the tab. Caution: This procedure actually terminates all sessions, so you are interrupting work in progress. Consequently, a message asks you to confirm that you actually want to do this. |
Reset the Deltas  | Deletes a statistic and restarts the count at zero. |
Path | Provides the directory and all subdirectories to the location of the file. |
File | Indicates the name, including suffix, of the file. |
Page Size | Indicates the size in bytes of each page in the file. |
Read-Only | Indicates whether the file is flagged as read-only by the operating system. |
Record Locks | Indicates whether any of the active handles for the selected file have record locks. Any application can read a locked record, but only the application that placed the lock can modify or delete the record. A record lock exists only as long as the application that opened the file is updating a record. “Yes” indicates that one or more record locks are applied to the file. “No” indicates that no records are locked. |
Transaction Lock | Indicates whether any of the active handles for the selected file have a transaction lock. A transactional file lock exists only as long as the application that opened the file is processing a transaction. |
Physical File Size | Indicates the size of the file in kilobytes (KB). This information is particularly useful for the capacity-based license model if you want to review data in use on a file-by-file basis. See also
Capacity-based License Model in PSQL User's Guide. Monitor uses kilobytes (KB) for the size of an individual file and megabytes (MB) as the units for resource usage (
Monitoring Resource Usage). License Administrator uses gigabytes (GB) as the units because that is how data in use is associated with a key. The different contexts require units appropriate for each context. If a file is immediately closed after you insert a large number of records, Monitor does not immediately reflect the changes in file size. For example, the statistics for Physical File Size KB are not refreshed for that file until the next time the file is opened for reading or writing. |
Client | Indicates the name (typically the login ID of the user) or an index to the Client list of the database server. |
Connection Number | Displays the network connection number of the client. If the client does not have a network connection, this field displays NA for “not applicable.” |
Task Number | Displays the process-supplied task number for processes originating at the server or a Windows Client. |
Site | Specifies the location of the user process (local or remote). |
Network Address | Identifies the location of the calling process on the network. If the calling process is SPX, the network node/network address is preceded by S: such as S: 65666768 00000000001. If the calling process is TCP/IP, the address is preceded by T4 for IPv4 addresses, T6 for IPv6 addresses, and T for the fully qualified domain name of a client machine. Examples: T4: 180.150.1.24 T6: 1234:5678:0000:0000:0000:0000:9abc:def0 T: <mymachine.mydomain.mycompany>.com |
Open Mode | Indicates the method the application uses to open the specified handle of the file. Valid open modes are the following: •Normal – The application that opened the file has normal shared, read/write access to it. •Accelerated – The application that opened the file has shared read/write access. •Read-only – The application that opened the file has read-only access; it cannot modify the file. •Exclusive – The application that opened the file has exclusive access. Other applications cannot open the file until the calling application closes it. Monitor also specifies all open modes as nontransactional or shared locking when applicable. |
Record Lock Type | Displays the type of record lock(s) currently held by the handle. The possible record lock types are Single, Multiple, and None. Single-record locks enable a user to lock only one record at a time. Multiple-record locks enable a user to lock more than one record at a time. |
Wait State | Indicates whether the user is waiting because of some type of lock on this handle: Waits for Record Lock, Waits for File Lock, or None. |
Transaction State | Displays the state of the transaction lock currently held by the handle. The possible transaction types are Exclusive, Concurrent, or None. |
Session | Provides a unique identifier for the connection. A session is defined as a client ID used by the MicroKernel Engine or a connection to the Relational Engine. Client ID is defined as a 16-byte structure that combines elements provided by the application, by the client platform, and by the database engine to uniquely identify a database transaction context. Session information reflects the sessions established through the MicroKernel Engine and through the Relational Engine. If you want to view sessions established only through the Relational Engine, see
Monitoring SQL Active Sessions. This tab allows you to delete a session or all sessions. See
Delete Selected Session and
Delete All Sessions. |
Connection Number | Displays the network connection number of the session. If the session does not have a network connection, this field displays NA for “not applicable.” |
Task Number | Displays the process-supplied task number for processes originating at the server, or from a Windows Client. |
Site | Specifies the location of the session process (local or remote). |
Network Address | Identifies the location of the calling process on the network. If the calling process is SPX, the network node/network address is preceded by S: such as S: 65666768 00000000001. If the calling process is TCP/IP, the address is preceded by T4 for IPv4 addresses, T6 for IPv6 addresses, and T for the fully qualified domain name of a client machine. Examples: T4: 180.150.1.24 T6: 1234:5678:0000:0000:0000:0000:9abc:def0 T: <mymachine.mydomain.mycompany>.com If multiple clients from a single machine connect by different TCP/IP addresses, each address is valid for that client. However, internally to the database engine, an address associated with a client may not be the actual address used by that client. This is because of the way the database engine identifies and manages multiple clients from the same machine. Consequently, since Monitor is reporting engine information, the tool may display an associated address instead of the actual address. |
Locks Used | Indicates the number of locks the session is currently using. |
Transaction State | Displays the type of transaction lock the session currently holds. The possible transaction types are Exclusive, Concurrent, or None. |
Read Records | Displays the number of records read since the session first opened a file. |
Inserted Records | Displays the number of records the session has inserted. |
Deleted Records | Displays the number of records the session has deleted. |
Updated Records | Displays the number of records the session has updated. |
Disk Accesses | Indicates the number of times the session required a disk access. You will not see any information for disk accesses for files that have just been opened. |
Cache Accesses | Indicates the number of times this client finds data in L1 or L2 cache in order to fulfill the request. |
Path | Provides the directory and all subdirectories to the location of the file. |
File | Indicates the name, including suffix, of the file. |
Open Mode | Indicates the method the application uses to open the specified handle of the file. Valid open modes are: Normal – The application that opened the file has normal shared, read/write access to it. Accelerated – The application that opened the file has shared read/write access. Read-only – The application that opened the file has read-only access; it cannot modify the file. Exclusive – The application that opened the file has exclusive access. Other applications cannot open the file until the calling application closes it. Monitor also specifies all open modes as nontransactional or shared locking when applicable. |
Record Lock Type | Displays the type of record lock(s) currently held by the handle. The possible record lock types are Single, Multiple, and None. Single-record locks enable a user to lock only one record at a time. Multiple-record locks enable a user to lock more than one record at a time. |
Wait State | Indicates whether the user is waiting because of some type of lock on this handle: Waits for Record Lock, Waits for File Lock, or None. |
Transaction State | Displays the state of the transaction lock currently held by the handle. The possible transaction types are Exclusive, Concurrent, or None. |
Engine Uptime | Lists the amount of time in weeks, days, hours, and minutes that the MicroKernel engine has been running. Engine Uptime is not a selectable column for Resource Usage. It is part of the grid title. |
Resource | Indicates the type of resource being monitored. See
Resource Types for Resource Usage Monitoring. |
Current | Indicates the current usage by a resource. |
Peak | Indicates the the highest value for a resource since the MicroKernel was started. |
Maximum | Indicates the highest allowed value for a resource. |
Files | Indicates the number of files currently open by the MicroKernel. The maximum for this resource is unlimited. |
Handles | Indicates the number of active handles. The MicroKernel creates a handle each time a user opens a file. A single session can have several handles for the same file. The maximum for this resource is unlimited. |
Clients | Indicates the number of clients accessing the MicroKernel. A machine can have multiple clients accessing the database engine simultaneously. The engine dynamically manages the client list. The maximum for this resource is unlimited (the number of clients is limited only by the memory in the computer). “Client” indicates a session established by a client ID (transactional engine interface) or a connection to the relational engine interface. The database engine uses various client sessions for its own internal processes, such as for accessing PSQL system files, metadata files, dbnames.cfg, and default system databases. The number of clients indicates both internal client sessions and non-internal client sessions (see
Monitoring MicroKernel Sessions). |
Worker Threads | Indicates the number of concurrent MicroKernel processes. |
User Count | Indicates the number of concurrently connected users. The maximum value shows the maximum permitted users as granted by a license agreement. |
Session Count | Indicates the number of sessions in use by the database engine. For brevity, “number of sessions in use” is also referred to “session count.” The maximum value (also called the “session count limit”) shows the maximum permitted sessions as granted by a license agreement. Session count reflects all sessions whether established through the MicroKernel Engine or through the Relational Engine. Messages pertaining to session count are logged to the various PSQL logging repositories. See
Reviewing Message Logs. The database engine uses various sessions for its own internal processes, such as for accessing PSQL system files, metadata files, dbnames.cfg, and default system databases. These internal sessions do not consume any session counts. |
Data In Use MB | Indicates in megabytes (MB) the size of all concurrently open data files. The maximum value is the maximum permitted amount of all concurrently open data files as granted by a license agreement. The maximum is also called the “data in use limit.” The value for data in use increases when a data file is first opened. Subsequent opens to an already open data file do not add to the total. Data in use also increases if an open file increases in size. Operations on an already open file continue to be permitted even if the size of the open file increases beyond the data in use limit. The value for data in use decreases when a data file is closed by the final user to have the file open. Since more than one user can access the same data file, all opens must be closed before data in use decreases. Messages pertaining to data are logged to the various PSQL logging repositories. See
Reviewing Message Logs. The database engine uses various files for its own internal processes, such as PSQL system files, metadata files, dbnames.cfg, and default databases. Files used for internal processes do not increase the value for data in use. If a file is immediately closed after you insert a large number of records, Monitor does not immediately reflect the changes in file size. For example, the statistics for “Data in Use MB” are not refreshed for that file until the next time the file is opened for reading or writing. |
Transactions | Indicates the number of transactions. The maximum for this resource is unlimited. |
Locks | Indicates the number of record locks. The maximum for this resource is unlimited. |
Engine Uptime | Lists the amount of time in weeks, days, hours, and minutes that the MicroKernel engine has been running. Engine Uptime is not a selectable column for MicroKernel Communications Statistics. It is part of the grid title. |
Resource | Indicates the type of resource being monitored. See
Resource Types for MicroKernel Communications Statistics. |
Total | Indicates the total number of occurrences processed since the database engine was started. |
Delta | Indicates the number of occurrences processed since you last accessed the MicroKernel Communications Statistics tab. To restart the count of the delta number, see
Reset the Deltas. |
Total Requests Processed | Indicates the number of requests the database engine has handled from workstations or remote, server-based applications. |
SPX Requests Processed | Indicates the number of SPX requests the database engine has handled from clients or remote, server-based applications. |
TCP/IP Requests Processed | Indicates the number of TCP/IP requests the database engine has handled from clients or remote, server-based applications. |
NetBIOS Requests Processed | Indicates the number of NetBIOS requests the database engine has handled from clients or remote, server-based applications. |
Connection Timeouts | Indicates the number of times Auto Reconnect has timed out when attempting to reconnect to Clients. See also
Auto Reconnect Timeout. |
Connection Recoveries | Indicates the number of times the Auto Reconnect feature has successfully recovered from a connection timeout. |
Resource | Indicates the type of resource being monitored. See
Resource Types for Resource Usage Pertaining to MicroKernel Communications Statistics. |
Current | Indicates the current usage by a resource. |
Peak | Indicates the highest value for a resource since the MicroKernel was started. |
Maximum | Indicates the highest value allowed for a resource. |
Communications Threads | Indicates the number of remote requests that the MicroKernel is currently processing. Local requests are not included in this statistic. For the total number of remote and local threads being processed, see
Monitoring Resource Usage. The database engine dynamically increases the number of communications threads as needed up to the maximum allowed. For Windows, Linux, and macOS, the maximum is 1024. Worker threads are also used to process Monitor requests, so you might not see the number of current worker threads drop below one. This is normal. |
Total Remote Sessions | Indicates the number of remote clients connected to the database engine. The maximum number is dynamic and displays as zero. |
SPX Remote Sessions | Indicates the number of remote clients connected through the SPX protocol to the database engine. |
TCP/IP Remote Sessions | Indicates the number of remote clients connected through the TCP/IP protocol to the database engine. |
NetBIOS Remote Sessions | Indicates the number of remote clients connected through the NetBIOS protocol to the database engine. |
User Name | Provides the login name of the user. |
Client Host Name | Identifies the name of the Client machine for the selected User Name. If unavailable, this is set to “Unknown.” |
Network Address | Identifies the Client machine’s IP or SPX address for the selected User Name. If unavailable, this is set to “Unknown.” Values displayed include IP, SPX, Shared Memory and Unknown. |
Client Application | Identifies the connected application or module. If unavailable, this is set to “Unknown.” |
Data Source Name | Identifies the name of the DSN referenced by the Client application. |
Connection Status | Specifies the connection status for the selected User Name. A status can be any of the following: •Active – The session has files open. and that Idle means that the session has no files open. •Idle – The session has no files open. •Dying – A temporary status that indicates an active session has been deleted but has not finished processing the SQL code. At a suitable termination point, the session is no longer listed on the SQL Active Session dialog. •Unknown – Status is unavailable. |
Active/Idle Period | Displays the duration of time, in milliseconds, since the connection has been active or idle. |
Total ConnectionTime | Displays the duration of time, in seconds, since the connection has been established |
-f | A required parameter to specify that a configuration file is providing input to the tool. |
filepath | The path to the configuration file. If omitted, Bmon checks the local directory for the configuration file. |
config_file | The name of the configuration file. The file name is of your choosing. By default, installation includes a working file named monconfig.txt in the bin directory of the PSQL installation directory, which includes comments documenting all available options. |
-runonce | Optional parameter to run bmon once and exit. This parameter is particularly useful when bmon is called from a batch file. See also
Running Bmon Without the Runonce Parameter. Note: In command line environments with no stdin, such as a remote PowerShell session, bmon uses this option even if it is not specified. To run bmon more than once, use the limitrefresh setting in the bmon configuration file. |
Refresh Options | Notes |
refreshrate=5 (pause for 5 seconds and then run bmon again) refreshrate=0 (pause until valid keyboard response received) | The value must be zero or a number 5 or higher. Default value in the sample file monconfig.txt is 5. |
limitrefresh=0 (manually stop bmon using Q or q + Enter) limitrefresh=n (run bmon n times and then exit) | Maximum value is 2147483647. Default value in the sample file monconfig.txt is zero. In sessions where stdin would be expected locally but is missing because of a remote connection, bmon exits with the warning “Interactive input failure detected.” Setting limitrefresh to 1 or higher suppresses this message. |
GUI Object | Description |
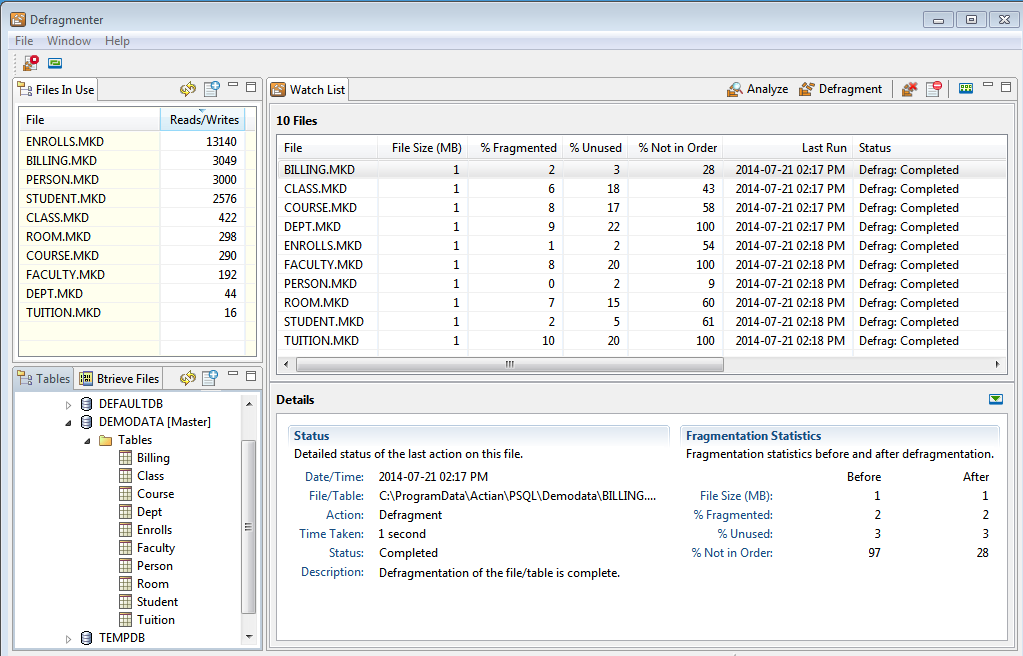
File menu | Allows you to set the refresh rate for the Watch List tab, exit Defragmenter, or exit PCC. |
Window menu | Allows you to return to the PCC window or to set preferences. |
Help menu | Allows you to access documentation and logs and to check the PSQL version. |
Icon | Meaning |
Cancel all defragmentation  | Allows you to manually stop all analysis or defragmentation. Cancellation means that any file currently being analyzed will show no new statistics. Files being defragmented but not yet finished will be unchanged. Files awaiting analysis or defragmenting will not be done. In the upper left corner of the window, click this icon to cancel all active analysis and defragmentation operations. You do not need to select any files to use this option. Note: You can cancel all operations from the Defragmenter window even if they were started at a command prompt, and vice versa. |
Set the automatic refresh rate  | Opens a dialog to set how often the Watch List tab updates progress. The value is in seconds. The default is 5. |
Refresh  | Allows you to manually refresh the list of items in the Files In Use, Tables, or Btrieve Files tabs. Note that setting the automatic refresh rate affects only the Watch List tab. |
Add to Watch List  | Enters selected items in the Watch List tab. Use Ctrl-click to add one item at a time to the selection or shift-click to select a range. You can also use Ctrl-A to select all items. |
Analyze file  | Gathers and displays fragmentation statistics for items selected in the Watch List tab. Use Ctrl-click to add one item at a time to the selection or shift-click to select a range. You can also use Ctrl-A to select all items. Analysis does not change the file being analyzed. |
Defragment file  | Starts defragmentation for items selected in the Watch List tab. Use Ctrl-click to add an item to the selection or shift-click to select a range. You can also use Ctrl-A to select all items. |
Cancel defragmentation  | Allows you to selectively stop analysis or defragmentation. Canceling means that files being analyzed show no new statistics. Files being defragmented but not finished are unchanged. In the icons to the right above the Watch List, this icon becomes available when files in the Watch List are undergoing analysis or defragmentation. Selecting one or more files and clicking this icon cancels the operation for those files. Use Ctrl-click to add one item at a time to the selection or shift-click to select a range. You can also use Ctrl-A to select all items. |
Remove file  | Removes an item from the Watch List tab. Use Ctrl-click to add one item at a time to the selection or shift-click to select a range. You can also use Ctrl-A to select all items. |
Select columns to display  | Opens a dialog of check boxes to customize the columns in the Watch List tab. The default is for all columns to be displayed. |
Show or Hide details  | Toggles the display of the Details pane. |
Statistic | Measures | Interpretation |
File size (MB) | File size in megabytes | The longer a file has been in use, the greater the amount of unused space it may contain, increasing its size. Smaller file sizes typically take less time to defragment, unless they have a large number of indexes. For Vx users, the larger size of fragmented files may be a concern, so defragmentation may help to stay within your license limit. |
% Fragmented | Percentage of data residing in blocks separated by unused space | Transactions over time can result in pages containing no data. The more these pages are intermixed with actual data pages, the greater the fragmentation. A lower percentage indicates fewer, larger data blocks stored closer together, allowing more rapid reads and writes. Note: This statistic is not supported for Btrieve 6.x and 7.x files. You can analyze and successfully defragment these earlier file versions, but no measurements can be shown for these statistics. |
% Unused | Percentage of unused space | Unused space is often created when a file is modified by insert, update and delete operations. The lower this percentage, the more compact the file, allowing more rapid reads and writes. Note: This statistic is not supported for Btrieve 6.x and 7.x files. You can analyze and successfully defragment these earlier file versions, but no measurements can be shown for these statistics. |
% Not in Order | Percentage of records not stored sequentially | Inserts over time result in a widening mismatch between the logical order of pages and their physical locations, increasing the time needed to locate data. A lower percentage generally gives higher performance for actions such as table scans on large files. Note: In some files, the lowest possible percentage not in order may be higher than zero. Further defragmentation does not decrease this statistic because records in the file are already stored as efficiently as possible. |
Last Run | Date and time of last action | Action can be Analyze or Defragment. |
Status | Report from last action | Blank for newly added item. Typically notice of analysis or defragmentation completed. |
Table | Logical location | Database and table or file name |
Path | Physical location | File system path |
Preference | When selected... |
Remember window layout. | Saves the current arrangement of Defragmenter tabs when you exit the tool, as well as the overall window size, height, and position. |
Don’t warn about incompatible actions during multi-select operations. | Stops the dialog box from showing when actions will be unevenly applied to items of different types. |
Don’t warn about canceling defragmentations again. | Stops the dialog box from showing a warning when you cancel an analysis or defragmentation. If you selected the check box in the dialog to confirm canceling, this box also becomes checked. To make the confirmation dialog appear again, clear this check box. |
Don’t warn about canceling all defragmentations again. | Stops the dialog box from showing a warning when you cancel all analysis and defragmentation operations. If you selected the check box in the dialog to confirm canceling, this box also becomes checked. To make the confirmation dialog appear again, clear this check box. |
to open the refresh rate dialog box. at upper right in the tab. Use Ctrl-click to add one item at a time to the selection or shift-click to select a range. You can also use Ctrl-A to select all items. Analyze. Defragment. on the right. In the dialog that appears, click Yes to confirm. The Defragmenter operation continues until you click Yes. on the left. This icon stops all analysis and defragmentation activity, while the one on the right is for selected files in the Watch List that are undergoing analysis or defragmentation...
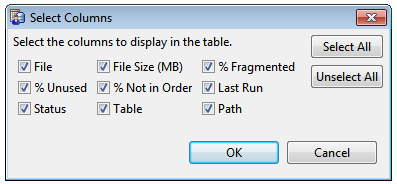
 .
. Command | Description |
dbdefrag files | Start defragmentation on one or more files. You may use asterisks as wildcards. Displays the number of records and keys processed. You can use Ctrl-C to cancel. In addition to path names, files can also be specified as a URI using the syntax brtv://user@host/dbname?parameters, as described under
Database URIs. |
dbdefrag -background files | Start defragmentation on one or more files as a background process. You may use asterisks as wildcards. |
dbdefrag -cancel files | Cancel the currently running analysis or defragmentation for one or more files. You may use asterisks as wildcards. Must be executed at a separate prompt unless the defragmentation is running in the background. |
dbdefrag -cancelall | Cancel all active analysis and defragmentation operations. Must be executed at a separate prompt unless the defragmentation is running in the background. Note: You can cancel all operations from the Defragmenter command prompt even if they were started in the Defragmenter GUI window, and vice versa. |
dbdefrag -status files | Show defragmentation status for one or more files. You may use asterisks as wildcards. Displays the following for the most recently completed defragmentation: •Status: Complete •Started: yyyy-mm-dd hh:mm:ss •Finished: yyyy-mm-dd hh:mm:ss •Time taken: nh:nnm:nns Displays the following for a defragmentation currently running: •Defragmentation status: In Progress •n out of n records processed (n%) •n out of n keys processed (n%) Displays the following for a canceled defragmentation: •Status: Defragmentation Canceled •Time taken: nh:nnm:nns File status remains available until the engine is restarted. After an engine restart, you can find status information in the PSQL event log (pvsw.log). |
dbdefrag -analyze files | Show fragmentation statistics for one or more files. You may use asterisks as wildcards. Returns the following: •% Fragmented •% Unused •% Not in Order •File Size (MB) •Estimated disk space needed for defragmenting (MB) Analysis does not change the file being analyzed. |
dbdefrag -ignore | Ignore errors during file processing. You can add this option to any command. It is useful when you are analyzing or defragmenting multiple files. Without the -ignore option, if one of the files being analyzed or defragmented returns an error, then the error is logged and analysis and defragmentation operations stop for remaining files. If you use the -ignore option, then the error is logged and analysis and defragmentation continue on the rest of the files. |
dbdefrag -help | Display the list of command options. |
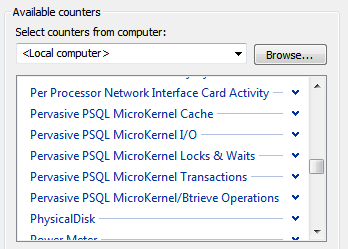
Counter | Description | Typical Use |
Btrieve Close Operations per Second | The number of Btrieve Close operations per Second | To provide insight into client application behavior. As a first step in troubleshooting issues, you may find it helpful to analyze behavior in terms of Btrieve operations. |
Btrieve Get/Step Operations per Second | The number of Btrieve Get and Step operations per second. See
Btrieve API Operations in Btrieve API Guide for the various Get and Step operations. | |
Btrieve Open Operations per Second | The number of Btrieve Open operations per Second | |
Btrieve Records Deleted per Second | The number of Btrieve records deleted per second | |
Btrieve Records Inserted per Second | The number of Btrieve records inserted per second | |
Btrieve Records Updated per Second | The number of Btrieve records updated per second | |
Change Operations per Second | The number of Btrieve operations that modify the data files per second | |
Operations per Second | The number of Btrieve operations executed per second |
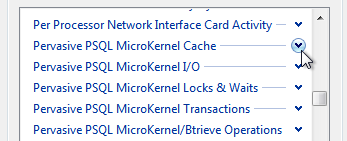
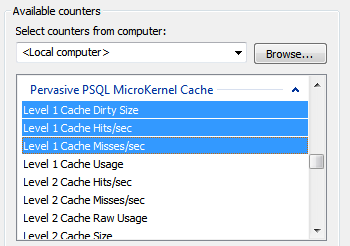
Counter | Description | Typical Use |
Cache Hit Ratio | The percentage of recent cache accesses that resulted in a hit from either the Level 1 or Level 2 Cache. | |
L1 Cache Discards/sec | The number of pages discarded from the Level 1 Cache per second in order to make room for a new page. Only occurs when the Level 1 Cache is full. Does not include pages moved from the Level 1 to the Level 2 Cache. | |
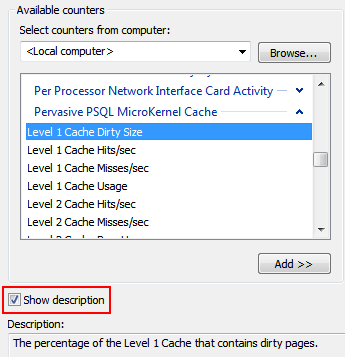
Level 1 Cache Dirty Percentage | The percentage of the Level 1 Cache in use that contains dirty pages | To help determine if heavily accessed pages are continuously being forced out of the cache, which may adversely affect performance. Dirty pages, ones with changes that have not been written to disk, may only reside in the L1 Cache. Under heavy write loads, the L1 Cache may predominately contain dirty pages. This forces pages out of the L1 Cache and into the L2 Cache, if configured, or out of the L1 Cache entirely. The database engine writes dirty pages to disk at scheduled intervals or when the L1 Cache gets close to full. Frequently writing pages to disk may also adversely affect performance. It may benefit performance to adjust the L1 Cache size so that the percentage of dirty pages is not always high. See also
Cache Allocation Size. |
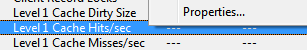
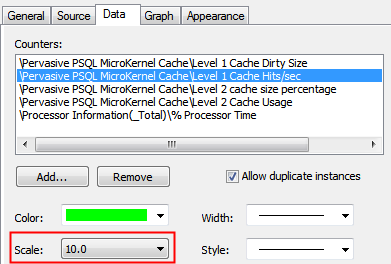
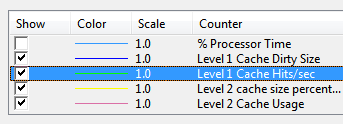
Level 1 Cache Hits per Second | The number of Level 1 Cache hits per second | To help determine how successfully the database engine finds requested pages in L1 Cache. A higher rate of hits-to-misses indicates that the engine is finding pages in L1 Cache rather than needing to access the L2 Cache or physical storage. |
Level 1 Cache Hit Ratio | The percentage of recent Level 1 Cache accesses that resulted in a hit. | |
Level 1 Cache Misses per Second | The number of Level 1 Cache misses per second | |
Level 1 Cache Usage Percent | The percentage of Level 1 Cache currently in use | To aid in adjusting the size of the L1 Cache to fit your application(s). For example, applications that use small or predominately read-only data files may not fill up the L1 Cache as configured by default. The unused memory is not available to the operating system or to other applications. You can change the L1 Cache size to release the memory back to the operating system. Conversely, if you want to have an entire database in memory, you can monitor this value to know when the setting is as desired. |
Level 2 Cache Hits per Second | The number of Level 2 Cache hits per second | To help determine how successfully the database engine finds requested pages in L2 Cache. A higher rate of hits-to-misses indicates that the engine is finding pages in L2 Cache rather than needing to access physical storage. |
Level 2 Cache Hit Ratio | The percentage of recent Level 2 Cache accesses that resulted in a hit. | |
Level 2 Cache Misses per Second | The number of Level 2 Cache misses per second | |
Level 2 Cache Size | The current size of the Level 2 Cache in bytes | To help determine the size of the optional L2 Cache. The L2 Cache is one component of the setting for
Max MicroKernel Memory Usage. That setting specifies the maximum proportion of total physical memory that the database engine is allowed to consume, which includes L1 Cache, L2 Cache, and all miscellaneous memory usage by the database engine. If the setting for
Max MicroKernel Memory Usage is non-zero, the L2 Cache sizes itself to stay within the memory limit of the setting. The L2 Cache monitors memory consumption of the system and resizes itself as needed. The memory used by the L2 Cache may also be swapped out by the operating system. |
Level 2 Cache Usage | The amount of the Level 2 Cache currently in use in bytes | |
Level 2 Cache Size Relative to Memory | Level 2 Cache size presented as a percentage of total system memory | To show what percentage of the total system memory the L2 Cache is using. |
Level 2 Cache Usage Percent | The percentage of Level 2 Cache currently in use | To show what percentage of the Level 2 Cache is currently being used. |
Counter | Description | Typical Use |
Pages Read per Second | The number of pages read from disk per second | To determine the interaction of the database engine and data read and written to physical storage. |
Pages Written per Second | The number of pages written to disk per second |
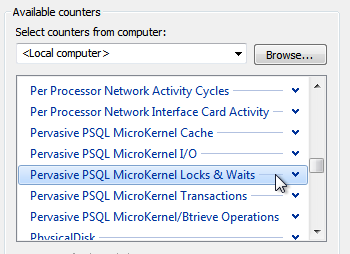
Counter | Description | Typical Use |
Client Record Locks | The number of records explicitly locked by clients | To provide insight into the work load of client applications. |
Waits on Active Reader Lock | The number of clients waiting on the Active Reader Lock. Multiple clients may hold the Active Reader Lock at the same time; however, the Active Reader Lock and the Active Writer Lock are exclusive. Consequently, a single client that holds the Active Reader Lock prevents any client from obtaining the Active Writer Lock. A single client that holds the Active Writer Lock prevents multiple clients from obtaining the Active Reader Lock. Each file has its own reader (and writer) lock. See also
Waits on Active Writer Lock counter. | |
Waits on Active Writer Lock | The number of clients waiting on the Active Writer Lock. Only one client may hold the Active Writer Lock for a file at a time. Each file has its own writer (and reader) lock. See also
Waits on Active Reader Lock counter. | |
Waits on File Locks | The number of clients currently waiting on a file lock | |
Waits on Page Buffers | The number of clients waiting on a page buffer to become available. If a page is not available to service a request, the request blocks until the MicroKernel is able to make a page available. | To indicate whether or not the database engine has a page buffer available in the cache. Use this value along with the memory cache counters to decide if the caches are sized appropriately for the work load. Increasing the cache size will increase the total number of available pages, which can reduce the waits on page buffers. Three things may cause this value to spike when pages are not in cache: •A data file was recently opened. •First time or infrequent access of a data page. •The caches may be too small to contain all of the pages frequently accessed and modified. The spike for the first two items cannot be avoided because of accessing a file for the first time. The third item can be avoided by using a larger cache. If the caches are full and the cache misses are high, it is possible that the caches may be too small to contain all the pages frequently accessed and modified. See also
Counters for MicroKernel Cache. |
Waits on Page Locks | The number of clients currently waiting on page locks | To provide insight into the work load of client applications. |
Waits on Page Reads | The number of clients waiting to read a page from disk. If a client is already in the process of reading the page, other clients must wait for the in-progress read to complete. | To help determine the number of clients trying to read the same page of the same file at the same time. |
Waits on Record Locks | The number of clients currently waiting on record locks | To provide insight into the work load of client applications. |
Counter | Description | Typical Use |
System Transactions in Progress | The number of system transactions in progress. A system transaction is a special type of transaction that prepares data file changes then persists the changes to the file. | To help determine if system transactions are occurring too frequently or not often enough. The database engine writes changes to the data files during a system transaction. The frequency at which a system transaction occurs is determined by two server data integrity configuration properties –
Initiation Time Limit and
Operation Bundle Limit. The server also automatically adjusts the frequency when the amount of free space in the L1 Cache is low. In general, running the system transaction too frequently or not often enough adversely affects performance. Typically, you will notice that the number of page writes per second may increase, the number of Btrieve operations that modify records may decrease, and the number of clients waiting on the Active Writer Lock may increase. It may take experimentation to determine an ideal interval for a particular work load. |
Transaction Commits per Second | The number of commits executed per second | To determine the number of application transaction commits. See also
End Transaction (20) in Btrieve API Guide. |
Counter | Description |
Page Server Pass-Thru Operations/sec | The number of pass-through operations received by the page server per second from cache engines. |
Page Server Page Requests/sec | The number of requests for a data file page received by the page server per second from cache engines. |
Page Server Invalid Page List Requests/sec | The number of requests for an invalid page list received per second from cache engines. |
Page Server Invalid Page List Piggy-backs/sec | The number of invalid page lists piggy-backed by the page server per second on responses to other cache engine requests. |
Page Server Invalid Page List Length | The current length of the page server invalid page list. |
Page Server Invalid Page List Adds/sec | The number of committed pages added to the page server invalid page list per second, counting duplicates. |
Page Server Invalid Page List Removals/sec | The number of entries removed from the page server invalid page list per second. |
Page Server Level 1 Cache Hits/sec | The number of Level 1 Cache hits by the page server per second. |
Page Server Level 1 Cache Misses/sec | The number of Level 1 Cache misses by the page server per second. |
Page Server Level 1 Cache Hit Ratio | The percentage of recent Level 1 Cache accesses by the page server that resulted in a hit. |
Page Server Level 2 Cache Hits/sec | The number of Level 2 Cache hits by the page server per second. |
Page Server Level 2 Cache Misses/sec | The number of Level 2 Cache misses by the page server per second. |
Page Server Level 2 Cache Hit Ratio | The percentage of recent Level 2 Cache accesses by the page server that resulted in a hit. |
Page Server Cache Hit Ratio | The percentage of recent cache accesses by the page server that resulted in a hit from either the Level 1 or Level 2 Cache. |
Page Server Level 1 Cache Usage Percent | The percentage of the Level 1 Cache currently in use only by the page server. |
Page Server Level 2 Cache Usage Percent | The percentage of the Level 2 Cache currently in use only by the page server. |
Counter | Description |
Cache Engine Pass-Through Ops/sec | The number of pass-through operations requested by the cache engine per second. |
Cache Engine Local Ops/sec | The number of local operations performed by the cache engine per second. |
Cache Engine Page Requests/sec | The number of data file pages requested by the cache engine per second. |
Cache Engine Page Invalidations/sec | The number of pages invalidated by this cache engine per second. |
Cache Engine FCR Invalidations/sec | The number of FCRs invalidated by this cache engine per second. |
Cache Engine Level 1 Cache Usage Percent | The percentage of the Level 1 Cache currently in use only by the cache engine. |
Cache Engine Level 1 Cache Hits/sec | The number of Level 1 Cache hits by the cache engine per second. |
Cache Engine Level 1 Cache Misses/sec | The number of Level 1 Cache misses by the cache engine per second. |
Cache Engine Level 1 Cache Hit Ratio | The percentage of recent Level 1 Cache accesses by the cache engine server that resulted in a hit. |
Cache Engine Level 2 Cache Usage Percent | The percentage of the Level 2 Cache currently in use only by the cache engine. |
Cache Engine Level 2 Cache Hits/sec | The number of Level 2 Cache hits by the cache engine per second. |
Cache Engine Level 2 Cache Misses/sec | The number of Level 2 Cache misses by the cache engine per second. |
Cache Engine Level 2 Cache Hit Ratio | The percentage of recent Level 2 Cache accesses by the cache engine that resulted in a hit. |
Cache Engine Cache Hit Ratio | The percentage of recent cache accesses by the cache engine server that resulted in a hit from either the Level 1 or Level 2 Cache. |
User Count License | The user count license model works well for traditional client-server applications in which many users or devices constantly add, update, and delete records from distinct individual desktops. Each product key specifies a licensed user count. A user count allows the specified number of concurrent connections to the PSQL database engine. Users are counted by network address. |
Capacity-based License | A capacity-based model shifts the emphasis from how many users to how much work the database server processes. The model is based on capacity to accommodate license enforcement in service bureau, software-as-a-service, or other multiplexed environments. For example, each instance of PSQL Vx Server has capacity limits on both the number of sessions in use and the data in use. |
GUI Object | Description |
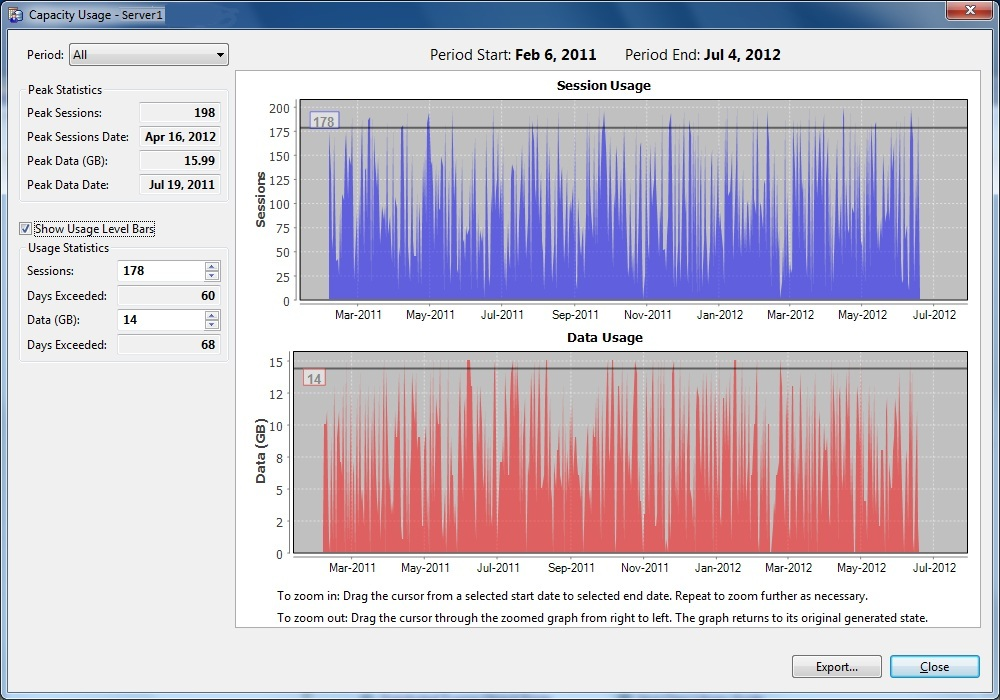
Title Bar | Identifies the engine you selected. |
Statistical Indicators | Displays meaningful statistics and enables you to select what you want to display in the graphs. See
Statistical Indicators. |
Time Designation | Displays starting and ending dates of the period for the data displayed in the graphs. |
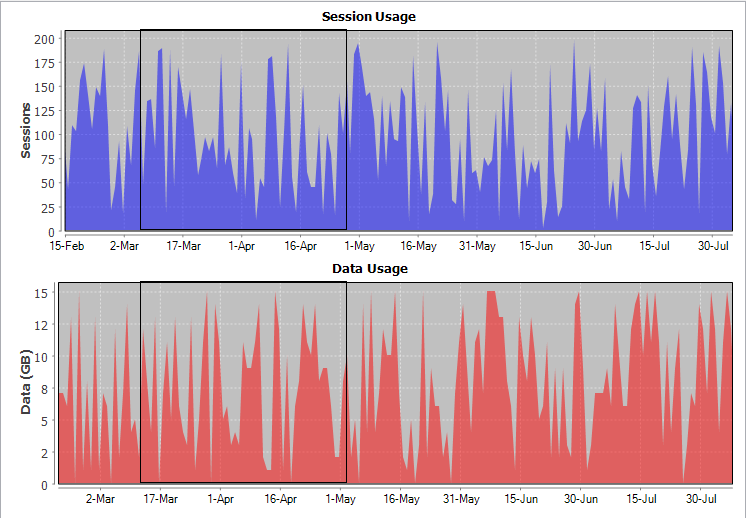
Session Usage Graph | Displays, graphically, the number of sessions that occurred concurrently during the selected time period. |
Data Usage Graph | Displays, graphically, the amount of data used during the selected time period. |
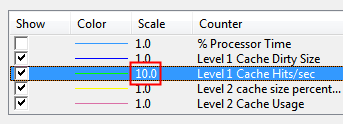
Usage Level Bars | Enables you to determine how often your usage exceeds a selected level. When selected, they appear across each graph at a default level that is 90% of peak usage. The number at the left of each usage level bar identifies its level (amount of data or number of sessions). You can move the usage level bar to whatever level you need, either by using the spin boxes or by dragging with the cursor. The two usage level bars are independent of each other. |
Zoom Instructions | Describes the general procedures for zooming in and out of a graph. For detailed procedures, see
Zooming. |
Export Button | Enables you to export the data to a .CSV file, if you find it useful to save the data for additional analysis. The Export button opens a Browse for Folder dialog, where you can select a location for data storage. |
GUI Object | Description |
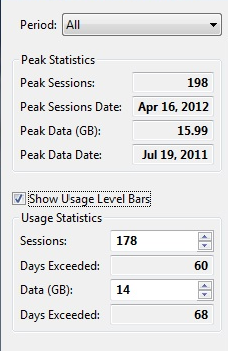
Period | Enables you to select the time period for the data you want the graphs to display. When the window opens, the graphs display, by default, the data from the period that was selected when the window was last closed. You can select a different time period: •All •Last week •Last 30 days •Last 90 days •Last 180 days You can also select a time period by zooming the graphs. When you zoom a graph, the Period drop-down menu displays Custom as the selected time period. |
Peak Statistics Group Box | Contains fields that display statistics for maximum use of data and maximum number of concurrent sessions during the time period displayed in the graphs. |
Peak Sessions | Displays the greatest number of concurrent sessions that occurred during the time period displayed in the Session Usage graph. |
Peak Sessions Date | Displays the date on which the greatest number of concurrent sessions occurred. If that number of sessions occurred more on more than one day, the most recent date is displayed. |
Peak Data (GB) | Displays the maximum amount of data, in gigabytes, used at one time during the time period displayed in the Data Usage graph. |
Peak Data Date | Displays the date on which the maximum amount of data was used. If that amount of data was used on more than one day, the most recent date is displayed. |
Show Usage Level Bars | Displays or hides usage level bars across the graphs, depending on whether it is checked or not. |
Usage Statistics Group Box | Contains spin boxes for moving the usage level bars up and down and fields that display the statistics that result from moving the usage level bars. |
Sessions | Sets the value at which to position the usage level bar in the Session Usage graph. |
Days Exceeded | Displays the number of days on which the number of concurrent session in use was greater than the level at which the usage level bar is set. |
Data (GB) | Sets the value at which to position the usage level bar in the Data Usage graph. |
Days Exceeded | Displays the number of days on which the amount of data in use was greater than the level at which the usage level bar is set. |
Item to Monitor | Using the Graphical User Interface | Using the Command Line Interface |
License information (All license information for an authorized key, such as the product, product key, status of a key), platform to which the license applies, license type, user count, session count, data in use, expiration date of a license, vendor software that installed the license, and application to which the license applies) | ||
User count (The number of allowed concurrent connections to the PSQL database engine permitted by a product key) | ||
Session count limit (The maximum permitted number of concurrent sessions as granted by a license agreement) | ||
Data in use limit (The maximum permitted total size of all concurrently open data files as granted by a license agreement) | ||
Number of authorizations remaining for a key |
Repository | Written To By |
License administration components | |
License administration components (Windows) All PSQL components (Linux, macOS, and Raspbian) | |
All PSQL components (Windows) |
Message Type | Change in State of Key | Scenario | |
From | To | ||
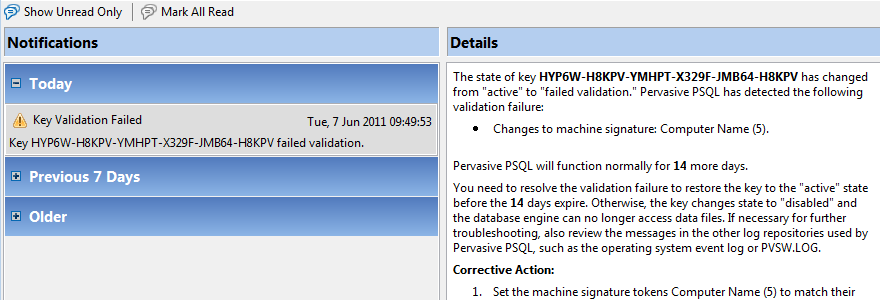
Warning | Active | Failed Validation | A validation action detects that the key has failed validation. For example, the machine signature cannot be determined, no longer matches the key, or one or more licensing components cannot be loaded. The database engine functions normally for a certain number of days so that you have ample time to correct the validation failures. |
Warning | Disabled | Failed Validation | Only some of the conditions that resulted in a disabled key have been corrected, but at least one condition still needs to be addressed. Because the key has changed state to failed validation, the database engine functions normally for a certain number of days so that you can correct the remaining validation failures. |
Error | Failed Validation | Disabled | The number of days provided to correct the failed validation have expired. The conditions causing the failed validation were not corrected before the expiration. The key is no longer valid and the database engine cannot access data files. |
Information | Failed Validation | Active | The conditions that caused the failed validation is corrected. The key is valid and the database engine has all functionality. |
Information | Disabled | Active | The condition(s) that disabled the key is corrected. The key is valid and the database engine has all functionality. |
Initiating Action | Logging Frequency | Logging Repository1 |
Key changes state as described in Table
53 | Immediately | •Notification Viewer •Operating System Event Log •PSQL Event Log |
Key remains in failed validation state | Once a day reminder | •Notification Viewer •Operating System Event Log •PSQL Event Log |
A validation action invoked programmatically through API call See
To Display Remaining Authorizations in PSQL User's Guide,
PvValidateLicenses() in Distributed Tuning Interface Guide, and
ValidateLicenses in Distributed Tuning Objects Guide. | Immediately | •Operating System Event Log •PSQL Event Log |
Warning or error messages originating from the PSQL licensing server | Immediately | •Operating System Event Log •PSQL Event Log |
1Message logging follows a one-way hierarchy: any licensing message logged to Notification Viewer is also logged to the Operating System Event Log and to the PSQL Event Log. Similarly, any licensing message logged to the Operating System Event Log is also logged to the PSQL Event Log. | ||
Option | Meaning |
(no option) | If you start the tool without specifying an option, the GUI opens and a tray icon appears if the operating system supports a system tray. |
-tray | Starts the tool with the GUI hidden and displays a tray icon. If the operating system does not support a system tray, the GUI opens instead of remaining hidden. |
Icon | Meaning |
 | Notification Viewer is running and monitoring licensing messages. This icon indicates a normal condition in which all messages have been read. |
 | Notification Viewer contains unread messages. This icon remains visible until all unread messages are read. See
Left panel. |
GUI Element | Description |
Toolbar | Provides two options: •Show only unread messages (toggle on, toggle off) •Mark all messages as read |
Left panel | Contains a scrollable list of messages. They are sorted with the latest messages on top and arranged in three groups: Today, Previous 7 days, and Older. You can expand and collapse each group. Each message shows an image for the type of information, a caption string, the message date and a brief description. All text is in a bold typeface if the message is unread. To “read” a message: click (select) the message. Once selected, the typeface for the message changes to a regular typeface. |
Right panel | Shows the message details, which provide a full description of the message, and when applicable, suggestions to resolve any issues. |
Bti.ini Parameters for SQLManager Section | Description |
MgrPort | Sets the port number used by the SQL Connection Manager. The default is 1583. |
MgrUseTransport | Sets the type of protocol used by the SQL Connection Manager. This must be set to TCP. |
LogEvent=msg_type | Specifies one of the following values for msg_type to indicate the type of messages logged to event.log (the default is 1): •0 – no logging •1 – errors only •2 – errors plus warnings •3 – errors plus warnings plus information messages •4 – errors plus warnings plus information messages plus connect.log |
InstallDirectory=/usr/local/psql | Activates the connection log: /usr/local/psql/connect.log |
Field | Contents |
Date | Automatic date stamp in mm/dd/yyyy format. |
Time | Automatic time stamp in hh:mm:ss format. Also indicates AM or PM. |
Component | File name of component returning the error (prefix only, no extension). |
Process | Instance ID of the component, which is the process ID of the component. |
Process Name | Path and name of the component, truncated to the last 15 characters. |
Computer Name | Name assigned to the machine hosting the process, truncated to the first 15 characters. |
Type | A single character: I for Information, W for Warning, or E for Error. |
Message | The message text which may be either a string retrieved from a resource associated with the calling component or a text string passed directly from the calling component. Some message text may contain numeric values, which may be in decimal or hexadecimal format. The characters “0x” precede any hexadecimal values to distinguish them from decimal values. Some message text may also contain information specific to an OEM application, such as a link to a vendor’s Web site and troubleshooting information. |
Date | Time | Component | Process | Process Name |
5/10/2011 | 9:53:06 AM | LicenseMgr | 9048 | NTDBSMGR.EXE |
Computer Name | Type Category | Message |
USRegion2Svr | W | License failed validation. Remaining Days: 14 |
Product | Cost | Platform | Discussion |
Hyperic www.hyperic.com | Contact Hyperic | Windows | Requires installing an agent on the monitored machine and opening a firewall port for the agent. |
Linux, macOS, and Raspbian | Requires enabling SSH on the monitored machine and opening a firewall port for SSH. | ||
Nagios www.nagios.org/ | Free | Windows and Linux | Requires installing an agent on the monitored machine and opening a firewall port for the agent. |
Spiceworks www.spiceworks.com | Free | Windows | Requires enabling remote WMI on the monitored machine and opening a firewall port for remote WMI. |
Linux | Requires enabling SSH on the monitored machine and opening a firewall port for SSH. | ||
System Center Configuration Manager (SCCM) www.microsoft.com | Contact Microsoft | Windows | Requires either an agent or enabling remote WMI on the monitored machine. The firewall is automatically adjusted when WMI is enabled. If an agent is used, also requires opening a firewall port for the agent. This product is available only for Windows operating systems. |
ZenOSS www.zenoss.com | Contact ZenOSS | Windows | Requires installing an agent on the monitored machine and opening a firewall port for the agent. |
Linux, macOS, and Raspbian | Requires enabling SSH on the monitored machine and opening a firewall port for SSH. |
Operating System Event Log Property | Value to Monitor |
Source | Pervasive SQL |
Category | Product Keys |
Type | Warning, Error |