Run Queries with Actian Director
The Vector AMI comes pre-installed with the ontimedb demonstration database, which is loaded with actual airline flight data from the U.S. Bureau of Transportation from 1987 to the present—175 million rows.
This first query displays the year, month, and number of flights per month ordered by year and then month from the ontime table of ontimedb.
Important! The root volume of an Amazon AMI is based on an Elastic Block Storage (EBS) snapshot, a standard practice when creating AMIs. These snapshots are stored on S3 and, as you access blocks on the volume, they are slowly loaded from S3 into EBS and served to the EC2 instance. This means that the first access to blocks of existing files after launching an EC2 instance from an AMI boot can be very slow. However, all subsequent accesses (even between instance reboots) are much faster.
This directly affects the sample queries against the ontimedb database that is included in the AMI, as the disk blocks for the ontimedb database files must be read from the S3 snapshot the first time the query accesses them. Although the sample queries that you will run in the following sections will be slow the first time, all subsequent queries will be fast and will continue to be fast through the EC2 instance restarts. For more information, see the AWS documentation at
http://docs.aws.amazon.com/AWSEC2/latest/UserGuide/ebs-initialize.html.
To run the sample query
2. On the Director Start page, click New Query.
3. Select ontimedb from the Select a Database dropdown.
4. Enter the following SQL command (copy and paste):
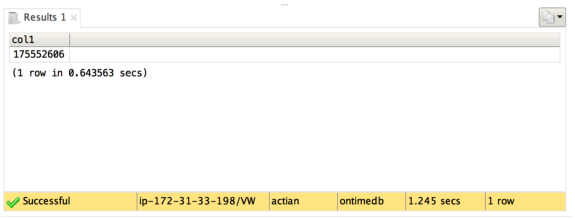
SELECT count(*) FROM ontime\g
5. Click Execute.
Results are displayed in the bottom half of the query tab:
6. Check the query execution time in the status bar at the bottom right of the query window.
You may run additional sample queries from
More Sample Queries.