How Busy Is My Cluster During the Test Run?
Tools like “top” can provide a simple overview of what processes are most active on any given machine. But running “top” across a cluster and getting a good sense of where the peaks and troughs lie is not easy or convenient.
So each Hadoop vendor has management tools that give a view of this; Hortonworks’ Ambari and Cloudera Manager, for example, both have machine activity graphing capabilities. But these tools are typically best used for watching activity as it is happening, rather than recording the data for offline analysis.
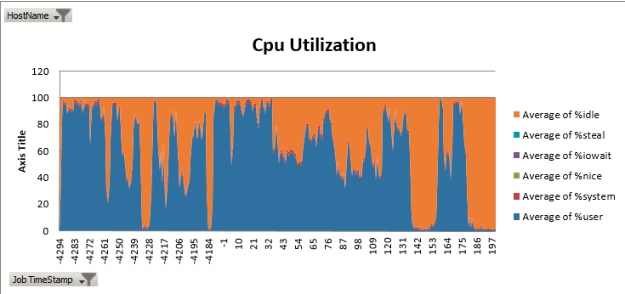
For this use case, we have found Intel’s Performance Analysis Tool to be very useful for logging and analyzing performance data across a cluster, including CPU, memory, network, and disk activity. It produces output as Microsoft Excel charts similar to the graph below:
The Performance Analysis Tool (
https://github.com/intel-hadoop/PAT) is open source and can be downloaded from Github. For instructions on installation and use, consult its Readme.