Stage 5--Run a Multi-user Concurrency Test
How Do I Run a Concurrency Test?
There are various ways to conduct concurrency testing, such as:
• Ask many people to run queries at the same time
• Use a tool such as Apache JMeter or HP LoadRunner to simulate user loads
• Create query execution scripts to automate the testing
All are valid options; choose the one that best fits your needs. Bear in mind that the first two options include the network communication layer between the client and the VectorH server, whereas the third option does not. It may be sensible to take the simplest possible approach first, and then layer in more complex infrastructure afterwards.
If you have query scripts that can be used, a tool on the Actian Github repository called “runall” will take a series of SQL scripts and execute a concurrent user test with them. The command looks like this:
./runall.sh -d pocdb -g N -i $II_SYSTEM -k Y -m 15 -n 150 -p N -s new-scripts
This command will run a 15 user test, with a total of 150 queries (so an average of 10 queries per user), by iterating through the SQL scripts found in the “new-scripts” folder. For an example, see Running the Performance Test Kit on page 1.
Tuning for Concurrency
The number of concurrent connections that a given VectorH instance will accept is governed by the connect_limit parameter, stored in config.dat and managed through the CBF utility. But there are usually more connections than executing queries, so how are resources allocated among concurrent queries?
By default, VectorH tries to balance single-query and multi-query workloads. The key parameters in balancing such workloads are:
• The number of CPU cores in the VectorH cluster
• The number of threads that a query is able to use
• The number of threads that a query is granted by the system
• The number of queries currently executing in the system
The first query to run in an installation is allowed to use as many threads as it is able to, up to the system-wide limit defined by max_parallelism_level, which defaults to all of the cores in the cluster. In this way, an “expensive” query will run on as many threads as can be executed on all of the CPU cores in the cluster, if the system is otherwise idle.
Starting from the second concurrent query, VectorH tries to evenly share the resources in a cluster among new queries, so that, for example, if there are five queries running in a 100-core system, then each query will be allocated up to 20 threads (if it can use them). This CPU allocation strategy continues (for example, the 20th query will be allocated 5 threads) until each new query receives only one thread per node. So for a cluster with N cores, the (N/2) + 1 query will execute on only one thread per node; for example with 100 cores, the 51st concurrent query will execute with only one thread per node.
The query, however, is not physically tied to execution on a specific machine or a number of cores, once the execution plan has been generated. The operating system controls how each query thread is given execution time on the CPUs in the machine, and query affinity is not used.
In fact, by default the number of cores in a system is over-allocated by 25% so the above calculation would actually operate on a maximum of 125 cores, rather than 100.
Although for the first few queries this thread allocation method leads to over-subscription of the number of threads versus available cores, if the query load is fairly constant this method results in a stable situation with properly divided resources as early, resource-heavy queries finish and later queries using fewer threads start. The operating system handles the initial over-subscription, but for concurrency tests the first and last N queries (where N is the level of concurrency) should be discarded from the test results to allow for test startup and shutdown lead and lag time.
If you know from the outset that you want to optimize for concurrent query execution, then you can constrain the early queries to use no more than N threads, even where they would otherwise have used more, in order to more evenly spread the CPU usage out across the queries (since default strategy gives greater weight to the “early” queries within a set). To do this, you can add a clause to the end of the SQL statement like this:
SELECT *
FROM lineitem
WITH MAX_PARALLELISM_LEVEL = 12
Alternatively you can change the installation default setting to affect all users and all queries, by changing the vectorwise.conf file and restarting VectorH.
Finally, you can also change the setting for all queries in a session by executing this command at the start of the session:
CALL X100 (SETCONF 'engine, max_parallelism_level, ''12''')
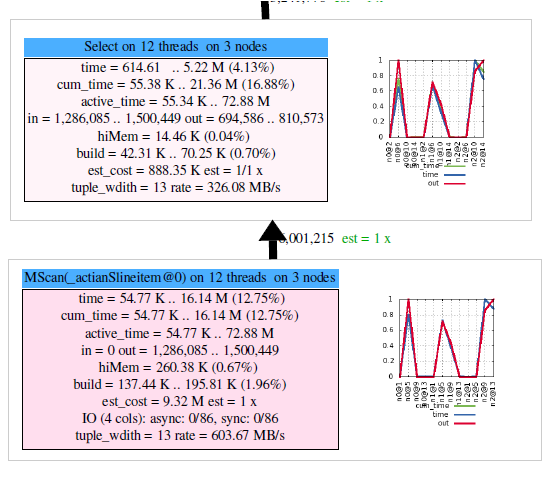
For any given query, you can see how many threads it has been allocated by looking at the query profile, a fragment of which (created by the x100profgraph tool mentioned later) is illustrated here. This query is using twelve threads in total over three nodes:
The number of threads that a query can profitably use is also influenced by the number of partitions in the main tables that the query accesses, since a thread is used to read each partition of a table. So, it is a good idea to have large tables partitioned into a number of chunks that is equal to the number of threads that you would like most queries to use. A sensible default here is 50% of the number of cores in the system.
Small Data Volumes
We have observed that some queries that operate on relatively small data volumes do not need to be executed in parallel to still run quickly. Queries processing even a few thousand rows can run well on just one or two cores, and actually run slower when given more cores, due to the inter-process communication overheads incurred.
So if your queries process only a small number of rows, consider making the max_parallelism_level settings very low from the outset if you are targeting large numbers of concurrent users.
How Busy Is My Cluster During the Test Run?
Tools like “top” can provide a simple overview of what processes are most active on any given machine. But running “top” across a cluster and getting a good sense of where the peaks and troughs lie is not easy or convenient.
So each Hadoop vendor has management tools that give a view of this; Hortonworks’ Ambari and Cloudera Manager, for example, both have machine activity graphing capabilities. But these tools are typically best used for watching activity as it is happening, rather than recording the data for offline analysis.
For this use case, we have found Intel’s Performance Analysis Tool to be very useful for logging and analyzing performance data across a cluster, including CPU, memory, network, and disk activity. It produces output as Microsoft Excel charts similar to the graph below:
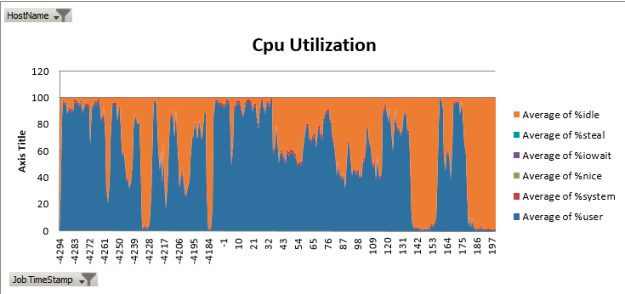
The Performance Analysis Tool (https://github.com/intel-hadoop/PAT) is open source and can be downloaded from Github. For instructions on installation and use, consult its Readme.
Last modified date: 01/26/2023