Understanding Usage Scenarios
Typical Use Scenarios
Typical scenarios where Vector demonstrates exceptional performance are those where large quantities of data must be analyzed, such as found in data warehousing, reporting, and data mining.
Reporting on DBT-3 Database Benchmark
An example scenario is the one modeled by the DBT-3 database benchmark, available in open source at http://osdldbt.sourceforge.net/.
This benchmark defines a data warehouse with customers placing orders consisting of multiple line items. Each line item is a number of parts; parts are supplied by multiple suppliers. The benchmark comes with a data generator (dbgen) and set of queries (22 reporting queries and 2 update streams). The size of the database can be scaled using a scaling factor (SF). The default SF is 1, which represents 1 GB.
The schema contains the following table and foreign key relationships:
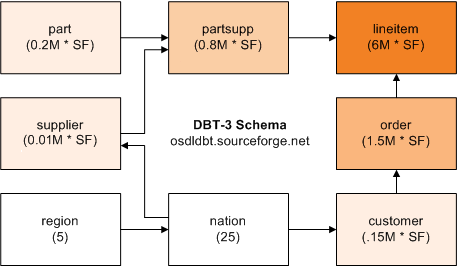
The largest table is “lineitem” (indicated in the drawing by the most saturated color). The number of tuples in each table is shown in parentheses. Arrows indicate the one-to-many relationships between tables.
This benchmark tests several business intelligence (BI) features, including:
• Joins between a large fact table (lineitem) and smaller dimension tables (part, supplier, nation, region), followed by groupings
• Large joins (between lineitem, order, and partsupp)
• Correlated subqueries
• Complex string predicates (such as LIKE)
• Top-N processing (getting the first N tuples of an ORDER BY)
How to Run the Benchmark
Note: The DBT-3 benchmark scripts run on Linux only. If you want to run the benchmark on Vector for Windows, you can generate the data on Linux, transfer the data files to Windows, and then load the data into a Vector for Windows database. Alternatively, install Linux emulation software on your Windows machine.
Running the benchmark involves the following steps:
1. Download the DBT-3 package, make the database generator tool, dbgen, and then generate the data using the dbgen tool (see Generate Data).
2. Start Vector.
3. Create a database.
4. Create a Vector table.
5. Bulk load the data into the table created in Step 4.
6. Create statistics using the optimizedb utility.
7. Run a reporting query.
Generate Data
The first step in running the benchmark is to download the DBT-3 package, make the database generator tool “dbgen”, and generate the data.
To download the DBT-3 package and make the dbgen tool
1. Download the DBT-3 package from here:
2. Decompress and unarchive the downloaded file:
tar xvfz dbt3-1.9.tar.gz
3. Make the database generator tool, dbgen:
cd dbt3-1.9/src/dbgen
make
To generate the 30 GB version of the benchmark
Issue the dbgen command with the following flags at the operating system prompt:
dbgen -vfF -s 30
In this example, we will use only the lineitem table; you therefore can add -T L to the command line to generate only the “lineitem.tbl” text file.
The system responds with:
DBT-3 Population Generator (Version 1.3.0)
Copyright Transaction Processing Performance Council 1994 - 2000
Generating data for lineitem table [pid: 7552] done.
Start Vector
If Vector is not running, start it using the ingstart command.
To start Vector
Issue the following command at the command line:
ingstart
Vector is started.
Create a Database
Use the createdb command to create a database.
To create a database named “dbtest”
Issue the following command at the command line:
createdb dbtest
The database is created using an HDFS location for Vector data.
Create a Vector Table
To run the benchmark, we need to create the lineitem table. The CREATE TABLE statement by default creates a table with X100 storage.
To create the lineitem table with X100 storage
1. Connect to the database created in the previous step by issuing the sql command at the operating system prompt, as follows:
sql dbtest
The Terminal Monitor starts.
2. Type the following SQL statement at the terminal monitor prompt:
CREATE TABLE lineitem (
l_orderkey INTEGER NOT NULL,
l_partkey INTEGER NOT NULL,
l_suppkey INTEGER NOT NULL,
l_linenumber INTEGER NOT NULL,
l_quantity DECIMAL(2,0) NOT NULL,
l_extendedprice DECIMAL(8,2) NOT NULL,
l_discount DECIMAL(2,2) NOT NULL,
l_tax DECIMAL(2,2) NOT NULL,
l_returnflag CHAR(1) NOT NULL,
l_linestatus CHAR(1) NOT NULL,
l_shipdate ANSIDATE NOT NULL,
l_commitdate ANSIDATE NOT NULL,
l_receiptdate ANSIDATE NOT NULL,
l_shipinstruct CHAR(25) NOT NULL,
l_shipmode CHAR(10) NOT NULL,
l_comment VARCHAR(44) NOT NULL)
WITH PARTITION = (HASH ON l_orderkey x PARTITIONS)\g
Notes:
• On the WITH PARTITION clause, x represents the number of partitions across which the table will be created. See VectorH Partitioning Guidelines on page 38.
• We recommend declaring key constraints. (We did not do so here for the sake of brevity.) If a column always contains a value, then you should define the column as NOT NULL.
Bulk Load the Data into the Table
Use the vwload utility to load the lineitem.tbl text file generated by the dbgen utility for the 30 GB data size (SF=30). This step assumes this file is available in the local directory.
To load the data into the lineitem table
Type the following command at the Actian Command Prompt:
vwload --table lineitem --fdelim "|" dbtest lineitem.tbl
It may take several minutes to load the 180 million rows, depending on the speed of your hardware and CPU.
To speed up the load, you can divide the lineitem.tbl file into multiple files of roughly equal size, and then use the --cluster flag to execute in parallel mode. For example:
vwload --table lineitem --fdelim "|" --cluster dbtest lineitem1.tbl lineitem2.tbl
Note: Bulk-loading goes through the SQL client (the sql utility) over a network connection to Vector. The bottleneck is client parsing and network handling if loading remotely, rather than the Vector Server.
Create Statistics
After loading data, we recommend that you run the optimizedb command or CREATE STATISTICS statement to create statistics that the query optimizer uses to create query plans. By default, the optimizedb utility optimizes all tables and columns in the database by looking at all rows.
Note: We highly recommend creating statistics. Skipping this step may lead to query plans that are inefficient; in extreme cases, it may lead to inability to execute a query.
Vector will automatically generate statistics for columns in Vector tables that have not already had optimizedb or CREATE STATISTICS run for them. This essentially removes the risk of not creating statistics for some columns, but it does add a slight overhead to the query that triggers the initial creation of the statistics.
To run optimizedb on the database dbtest
Issue the following command from the command line:
optimizedb -zns dbtest
The -zns flag speeds the building of the histogram.
Run a Reporting Query
The final step in running the benchmark is to run a reporting query.
This example reporting query (Q1) asks for the amount of business that was billed, shipped, and returned in the last quarter of 1998:
SELECT l_returnflag, l_linestatus, sum(l_quantity) as sum_qty,
sum(l_extendedprice) as sum_base_price,
sum(l_extendedprice * (1 - l_discount)) as sum_disc_price,
sum(l_extendedprice * (1 - l_discount) * (1 + l_tax)) as sum_charge,
avg(l_quantity) as avg_qty, avg(l_extendedprice) as avg_price,
avg(l_discount) as avg_disc, count(*) as count_order
FROM lineitem
WHERE l_shipdate <= date '1998-12-01' - interval '90' day
GROUP BY l_returnflag, l_linestatus
ORDER BY l_returnflag, l_linestatus;\g
Executing . . .
returnflag linestatus sum_qty sum_base_price sum_disc_price
A F 1132676958 1698421699729.99 1613502554023.1240
N F 29581022 44353456023.61 42135855268.9589
A F 1132676958 1698421699729.99 1613502554023.1240
N F 29581022 44353456023.61 42135855268.9589
N O 2230403478 3344516955134.66 3177286529933.9344
R F 1132872903 1698719719123.67 1613789096673.0512
sum_charge avg_qty avg_price avg_dis count_order
1678049479312.961024 25.4 38236.375 0.050 44419004
43821835543.370384 25.5 38270.478 0.049 1158947
3304387310370.192384 25.4 38235.736 0.049 87470970
1678345906004.148224 25.5 38243.421 0.049 44418612
(4 rows)
Last modified date: 01/26/2023