Using the DataExchange Monitoring Tools
DataExchange allows you to configure replication sessions, initiate replication, monitor it, and log it. The tools with which you perform these actions are the Replication Progress and Log Viewers. Their window is accessed from Control Center (ZenCC).
These viewers are covered in the following topics:
Checking the Replication Engine and Service
To view engine and service state
1. From Control Center (ZenCC), right-click the Replication - Connected node and select View Engine and Service State.
2. The Engine and Service State dialog box opens, similar to the following: 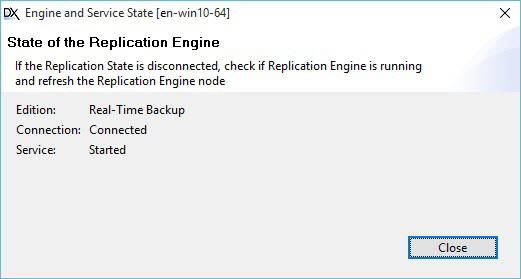

The information displayed in this dialog is only for information and cannot be edited.
To view the state of a database
1. In ZenCC, right-click the Replication node under a specific database and select View Database State.
If the database has been activated, the following dialog appears. 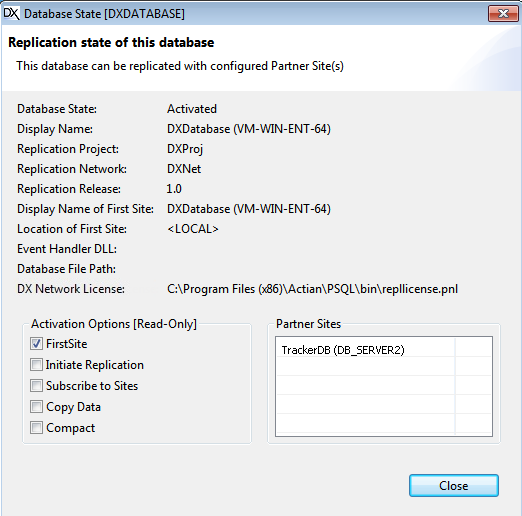

All of the fields in the dialog are read-only.
The types of states include the following:
• DNA. This indicates that the database is the replication system database: Database Network Analysis (DNA). This database has a data source name like PD00000x and is created when you install DataExchange.
Caution! Do not delete this database. DataExchange will not function if you do.
• Pure. This indicates that the database does not contain replication control tables. That is, the database has not been activated nor is it a template.
• Template. This indicates that the database is a replication template.
2. Click Close when you are done.
Initiating Replication from the Progress and Log Viewers
You can manually initiate a replication session. The Initiate Replication dialog box lets you select a database to replicate, the type of replication, and the sites to include. This topic covers the following:
Initiating a Replication Session
To initiate replication
1. In ZenCC right-click the Replication - Connected node in Zen Explorer and select one of the following:
• Initiate Replication
• Statistics and Log Views to open the Replication Progress and Log Viewers and then in the toolbar, click the Initiate replication icon  .
.
 .
.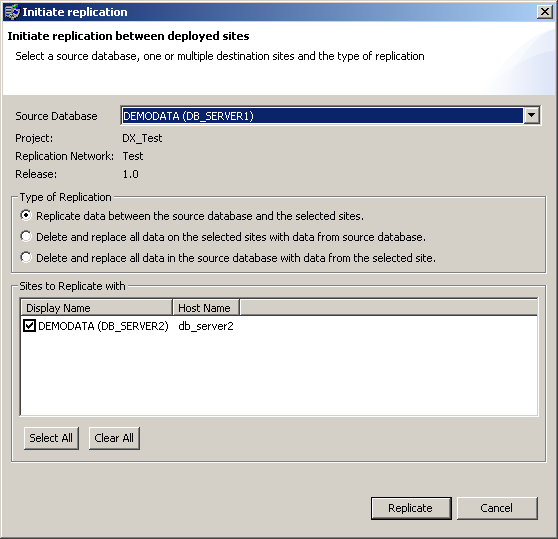
2. In the Initiate Replication dialog, select a database from the Source Database list.
3. Click the type of replication you want. Choose one of the following options:
• Replicate data between the source database and the selected sites.
This option replicates data between the source database and the selected sites. This default causes the replication engine to replicate the data among the machines specified, resolving any data conflicts. Either default conflict handling is used (most recent change wins) or an event handler callback DLL is used if you set one at activation time.
• Delete and replace all data on the selected sites with data from the source database.
This option deletes and replaces all data on the selected sites with data from the source database. This deletes all data on the sites you check mark in the list of sites to replicate with. The data from the source database replaces the data. The source database can be used to delete and replace data on one or more sites. Conflict resolution is not performed.
• Delete and replace all data on the local site with data from the selected site.
This option deletes and replaces all data on the local site (the source database) with data from the selected site. This deletes all data in the source database and replaces it with the data from the selected site. You can designate only one selected site (a one-to-one situation). Conflict resolution is not performed.
4. Check mark the sites with which you want to replicate with the source database. Clear the check mark for the sites you do not want to participate in the replication.
5. Click Replicate.
Note: The list of sites to replicate with may seem inconsistent depending on how you activated your Partner Sites.
Reading the Initiate Replication Dialog Box
The list of sites to replicate with may seem inconsistent depending on how you activated your Partner Sites. For example, you create Partner Site PS1 and perform an initial replication with the First Site (the default behavior). You create Partner Site PS2 but do not perform an initial replication with the First Site.
In the Initiate Replication dialog, if you select as the source database the First Site or PS1, neither shows PS2 as a site to replicate with. This may lead you to question, "What became of my second Partner Site? Why isn't PS2 in the list?"
It is not in the list because the information about the replication network, such as the sites on it, is also replicated. If you select PS2 as the source database, the choice First Replication Site shows as a site to replicate with. After you replicate with the First Site, then PS2 appears in the list for the First Site and PS1.
The easiest way to ensure consistency in the list is to perform an initial replication with the First Site when you activate each Partner Site. A Partner Site cannot replicate with other sites until it replicates with the First Site.
Capturing Replication Activity in the DRE Log
The DataExchange replication engine (DRE) records its operations in the file dre.log, located by default in C:\ProgramData\Actian\Zen\Replication\LogFiles. You can review replication activity in this log from ZenCC by right-clicking the Replication icon under the Databases branch and selecting Statistics and Log Views. You can also use a text editor to open the log file directly.
Where appropriate, the messages in the dre.log include the user-supplied names for the database, replication project, replication network, and replication release. The local database is referred to by its data source name (DSN). Remote sites are referred to by their display name and a site number. Remote sites typically have the same database name as the local site.
Each site in every replication network is numbered, beginning at 1,000,000 for the First Site, and incrementing by one for each site thereafter. These numbers appear as base 36 numbers. The dre.log is the only log that uses base 36 site numbers.
The type of message in dre.log is indicated by a letter in the first column of the entry, as follows:
• D – debug
• E – error
• I – information
• T – trace
• W – warning
The setting of logging levels and their meanings is documented in DataExchange Manager Tasks.
Last modified date: 12/01/2023