Zen System Analyzer (ZenSA)
The following topics cover Zen system analysis and diagnostics:
ZenSA Concepts
Zen System Analyzer (ZenSA) is a tool that allows you to perform the following actions:
• View the Zen components on your system with version information, usage status, size, and location.
• Identify duplicate components on your system.
• Test your network communications to verify connectivity.
• Test connectivity to the MicroKernel Engine.
• Test connectivity to the Relational Engine.
View Modules
This option allows you to view all Zen components and any other files you specify. You can add additional components to the search list. Their versions, usage status, file size, and location is displayed. Duplicate files are identified so you can resolve any potential conflicts.
View modules scans a machine for Zen components to determine which ones are loaded into memory.
Test Active Installation
This option allows tests of the network connectivity between a Zen client and the MicroKernel Engine and Relational Engine. If errors are detected, ZenSA gives you detailed troubleshooting information to help you resolve the problem.
Network
The Network Communication tests verify that your client or workstation can communicate with network protocols to reach the machine where the Zen database engine is installed. For the TCP/IP protocols, both IPv4 and IPv6 numeric and named addresses are supported. See also Drive-based Formats in Getting Started with Zen for additional details about IPv6.
Using Advanced Settings, you can select the protocols to test as well as the number of stress test messages to send. By default, the network test connects using any available protocol that is installed on the system and configured for use in Zen. See the Supported Protocols configuration parameter found in Advanced Operations Guide.
The progress bar will finish for all selected tests. Here are the steps for testing network communication:
1. Verify available protocols.
2. Verify network client availability.
3. Qualify target name.
4. Resolve target location to network address.
5. Verify server address.
6. Verify server connection.
7. Run stress test.
Transactional Engine
This test verifies the ability of your client to connect to a Zen database through the MicroKernel Engine.
When you run this test, ZenSA attempts to perform basic database operations that are common to most MicroKernel Engine applications. If your machine passes this test, then it verifies the following things:
• The MicroKernel Engine is responding.
• Your client interface components are installed correctly.
• The network communication between the client and the database engine is functioning correctly.
• MicroKernel Engine applications running on your computer should function correctly.
Relational Engine
This test verifies the ability of your client to connect to a Zen database engine through the Relational Engine. When you run this test, ZenSA attempts to perform common SQL database operations. A dialog box appears during the tests to show progress.
If your system passes this test, then the following is verified:
• The Relational Engine is responding.
• Client interface components are installed correctly.
• Network communication between the client and the database engine is functioning correctly.
• SQL applications running on your computer should function correctly.
Frequently Asked Questions
Listed below are some frequently asked questions about ZenSA.
What is the default log file name?
The default file name for the log file is ZenSA.log.
Can I use a different log file name?
You can rename the file, but the renaming applies only for that session of ZenSA. The next time you execute ZenSA, the name defaults once again to ZenSA.log.
What is the local default location for the log file?
The default local location for the log file is under the application data directory in the logs folder.
For default locations of Zen files, see Where are the files installed? in Getting Started with Zen.
What is the remote default location for the log file?
The default location for the log file is always the directory where psawizrd.exe is located on a Windows machine.
What kind of information is contained in the log file?
The log file records any process performed by ZenSA and includes the associated time stamp.
What happens to the information in the log file each time the tool is run?
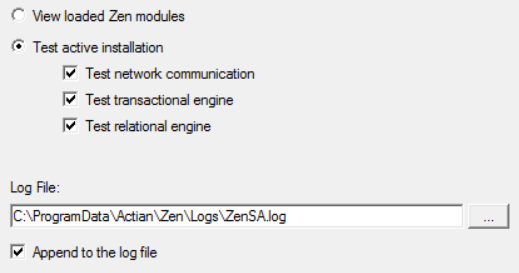
New information is appended to the log file each time ZenSA runs if the option Append to log file is selected (see Figure ZenSA GUI Visual Reference). If the option is not checked, the log file contains only information for that particular execution of ZenSA.
How do I run ZenSA?
See To start ZenSA.
When would I want to use ZenSA?
The following lists the most common situations where you would want to use ZenSA:
• You are encountering network errors and wish to test your client's connectivity to a machine running a Zen database engine.
• Your application is not functioning correctly and you wish to test connectivity to the database engine.
• You wish to view the Zen components on the system, loaded in memory, or both.
ZenSA GUI Visual Reference
The following dialog in ZenSA provides access to its functionality and shows the default settings. Click an area of the image to learn more about that option.

GUI Object | Description | Related Information |
|---|---|---|
View loaded Zen modules | Displays all current Zen components and version information in a table. Also allows you to add additional components to the matrix. | |
Test active installation | Test the Zen installation in three ways: network connectivity, functionality of the MicroKernel Engine, and functionality of the Relational Engine. Select the options that correspond to the tests you wish to perform. | |
Test network | Test the network connectivity to a machine running the database engine. The network tests display detailed information about any problems encountered during the test and provide suggestions on how to remedy the problems. | |
Test transactional engine | Tests the functionality of the MicroKernel Engine. | |
Test relational engine | Tests the functionality of the Relational Engine. | |
Log file | Allows you to specify a different log file location than the default. ZenSA logs detailed information on the tests it performs. You can use this log file to review tests at a later time or forward them to Actian Technical Support if needed. The Append to the log file option adds content to the end of the log file to provide a running history. If this check box is clear, then each ZenSA session replaces the file. |
ZenSA Tasks
Click any of the following categories or individual tasks to go to their documentation.
General Tasks
To start ZenSA
1. Access Zen System Analyzer from the operating system Start menu or execute psawizrd.exe from a command prompt.
For default locations of Zen files, see Where are the files installed? in Getting Started with Zen.
View Modules Tasks
To select options for View Modules
1. Start ZenSA and click Next.
2. Click View Loaded Zen Modules.
3. Click Next.
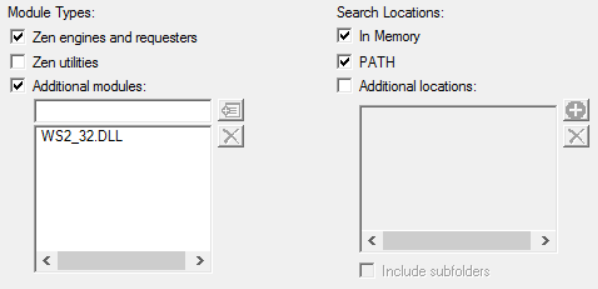
A dialog appears similar to the following:

If In Memory is selected, ZenSA searches for all Zen components loaded in memory, regardless of whether they are located in the PATH or other specified locations.
If you want to add components to the search list, do the following:
a. Click Additional modules (if it is not already selected).
b. Enter the file name (without a drive letter or path).
c. Click Add Component  .
.
 .
.d. If the component you added is not in the path, add the path to the searched locations.
If you want to add more paths to the search locations, do the following:
a. Click Additional locations.
b. Click Add Location  .
.
 .
.c. Browse to the location, select it, and click OK.
d. If you also want all directories below the location to be searched, click Include subfolders.
4. Click Next.
5. View the grid that shows the components found.
If files of the same name are detected, the multiple occurrences are marked with an icon on the left side:  .
.
If you see multiple occurrences of a component, you can adjust the list so that the occurrences sort together. To do this, click the Module column heading.
Multiple occurrences of a file does not necessarily represent a problem with your configuration. Their identification can help you troubleshoot issues with components depending on the situation. For example, if you see two Zen components both marked with the same version, you may want to check which is loaded in memory and that the components are located where you expect.
6. Click Next.
7. Click Finish if you are finished using ZenSA, or click View Log File to view the log.
Test Active Installation Tasks
You can check the currently active installed server in three ways:
Test at the Network Level
To test your network
1. Start ZenSA and click Next.
2. On the Options dialog, click Test active installation (if it is not already selected).
3. Click Test network communication (if it is not already selected).
4. Click Next.
5. For Target machine, type the machine name or TCP/IP address of the machine you wish to test. You may also enter localhost for the local machine. The machine can be the machine where you are currently located or a remote machine.
6. If you want to control how the tests are run, click Advanced Settings and do the following:
a. By default, ZenSA uses the first available protocol. You can force ZenSA to use one or more protocols by clicking Use Only These Protocols.
b. Select the protocol options that you want ZenSA to test.
c. Specify the number of stress test messages to send by entering a value for test messages. The default is 75. After successfully connecting using any protocol, ZenSA sends stress test messages to ensure that the connectivity is functioning correctly.
d. Click OK to save the changes.
7. Click Next to start the test.
ZenSA runs a series of tests and displays the results.
If the test succeeds, ZenSA informs you that all test messages were successfully transmitted. If the test fails, ZenSA lists the issues along with tips on how to resolve them. The tips are also written to the ZenSA log file.
8. Click Next.
9. Click Finish if you are finished using ZenSA, or click View Log File to view the log.
Test at the MicroKernel Level
To test the MicroKernel (transactional) Engine
1. Start ZenSA and click Next.
2. On the Options dialog, click Test active installation (if it is not already selected).
3. Click Test transactional engine (if it is not already selected).
This test runs a series of transactional operations to simulate your client requester interacting with the database engine.
4. Click Next.
5. Provide a path name to the samples directory on the machine running the database engine. The default path should be correct if the database engine is running on the local machine. You can enter a path, or browse to one.
6. Select the operations you want to perform for the MicroKernel Engine (by default, all are selected):
• Create Data File (write access required)
• Read Data File
• Update Data (write access required)
• Insert Data (write access required)
7. Click Next.
ZenSA performs the tests and displays the results. A check mark indicates a test succeeds and an X indicates a test fails.
If all of the tests succeed, your client requester can communicate with the database engine.
8. Click Next.
9. Click Finish if you are finished using ZenSA, or click View Log File to view the log.
Test at the Relational Level
To test the Relational Engine
1. Start ZenSA and click Next.
2. On the Options dialog, click Test active installation (if it is not already selected).
3. Click Test relational engine (if it is not already selected).
This test runs a series of SQL operations to simulate your client requester interacting with the database engine.
4. Click Next.
5. For Machine Name, type the name or IP address of the machine where the engine data source name (DSN) resides, or browse to the machine (click  ).
).
 ).
). The name "localhost" is valid if you are testing the local machine.
6. For Engine DSN, type the name of the DSN for the data source you want to test. The default, demodata, uses the DSN for the sample database installed with the database engine.
7. Select the operations you want to perform for the Relational Engine (by default, all are selected):
• Create Table
• Read Data
• Update Data
• Insert Data
8. Click Next.
ZenSA performs the tests and displays the results. A check mark indicates a test succeeds and an X indicates a test fails.
If all of the tests succeed, your Zen Client can communicate with the Relational Engine.
9. Click Next.
10. Click Finish if you are finished using ZenSA, or click View Log File to view the log.
Log File Tasks
To view the log file after completing Zen System Analyzer
1. Click View Log File to open the ZenSA log file.
The file lists the tasks that ZenSA has completed.
To specify a different location for the ZenSA log file
1. Start ZenSA and click Next.
2. In the Log File field, enter a path to the ZenSA log file or browse to the desired location.
If you want a log file with information only about the current ZenSA session, clear the check box Append to the log file.
You can enter a different log file name and location, but these apply only for this ZenSA session. They revert to the default C:\ProgramData\Actian\Zen\logs\ZenSA.log the next time the wizard runs.
Last modified date: 09/15/2025