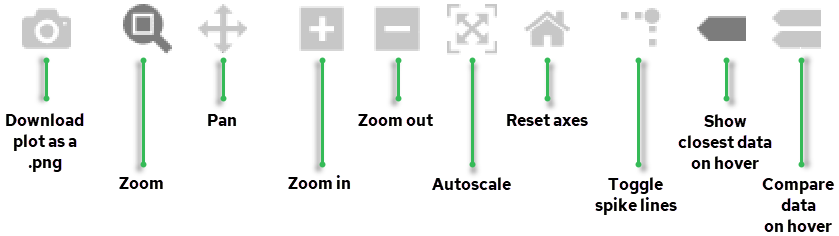
| Download plot as png |
Downloads and saves a captured image of the current view of the chart. For more information, see Download a Chart as a PNG File. |
| Zoom |
Holding and dragging the mouse zooms in on the selected area. For more information, see Zoom in on Graphing Data. |
| Pan |
Holding and dragging the mouse pans around the chart. |
| Zoom in |
Zooms in on the chart. For more information, see Zoom in on Graphing Data. |
| Zoom out |
Zooms out on the chart. For more information, see Zoom in on Graphing Data. |
| Autoscale |
Shows all chart data, even data outside of the axis area (if any). For more information, see Zoom in on Graphing Data. |
| Reset axes |
Resets chart axes to their original values. |
| Toggle spike lines |
Draws a dotted line for X and Y values to the intersection of the lines. |
| Show closest data on hover |
Shows the nearest data point value to the mouse pointer. |
| Compare data on hover |
Shows all available hover data at the same time. |