Tutorial: a chart and a table
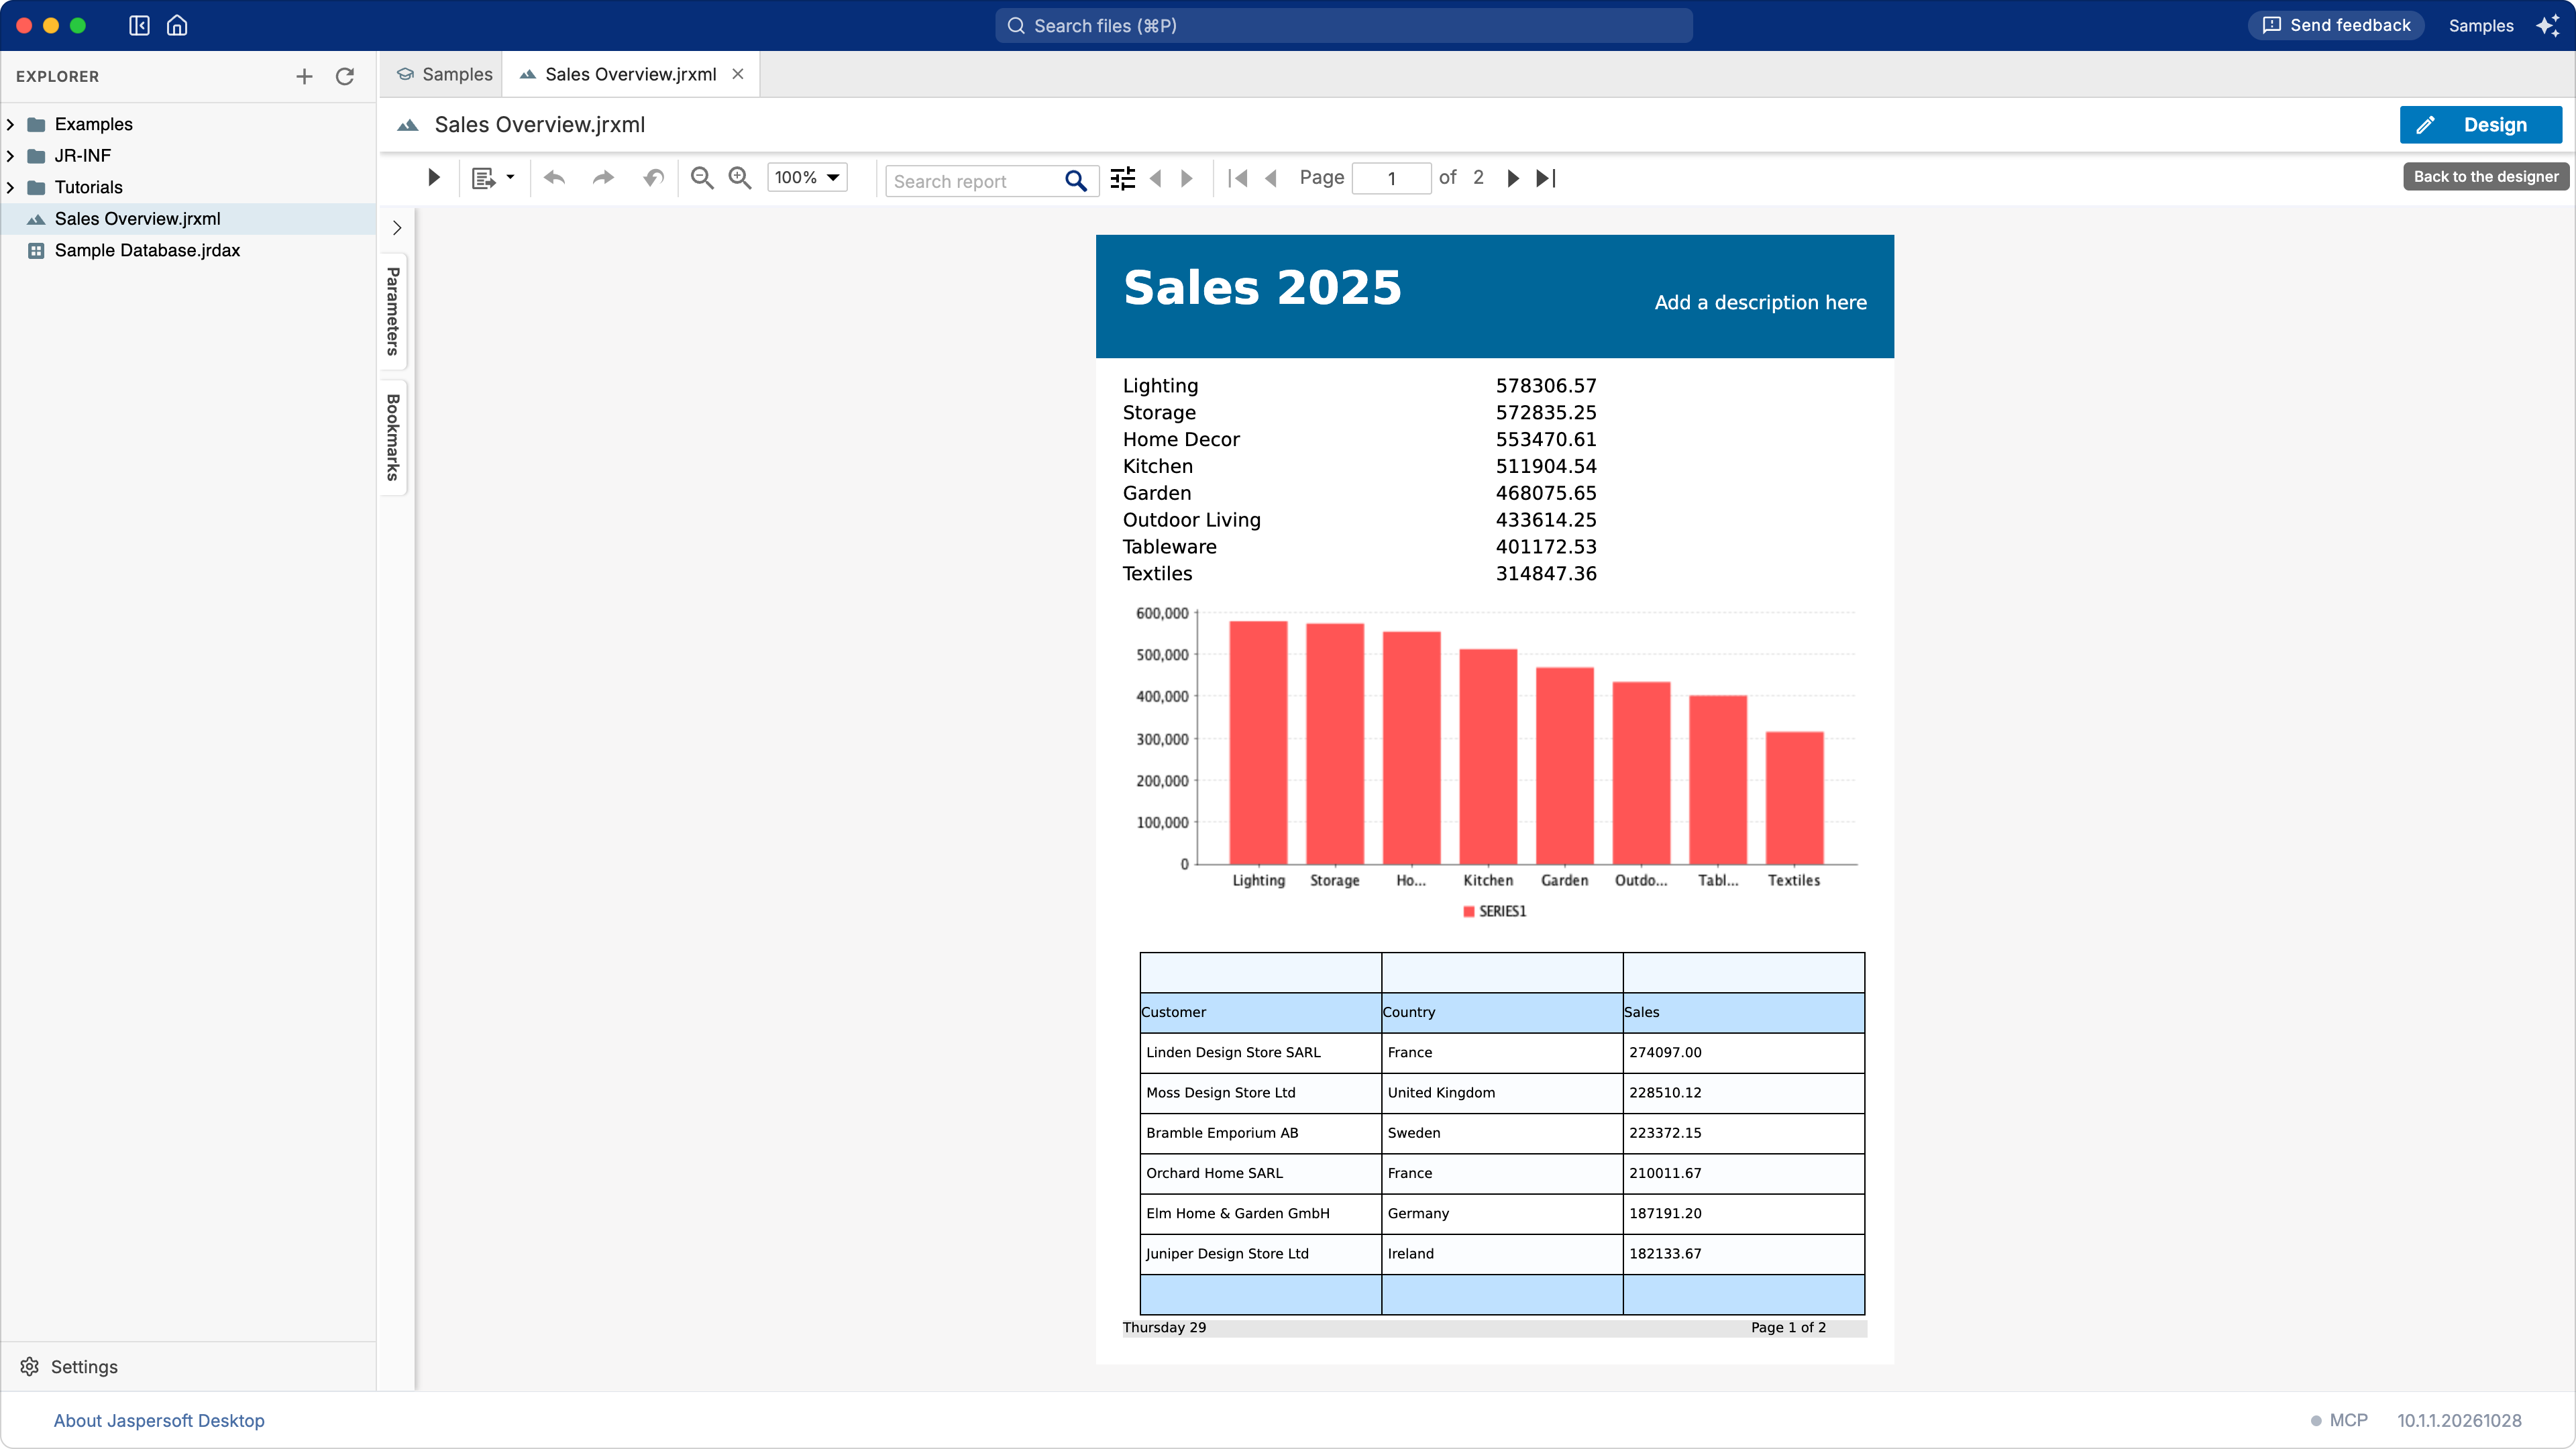
What you build: a one-page overview of the sales of 2025, from the sample database: the sales of each category, a bar chart of them, and a table of the ten best customers. What you learn: a report on an SQL query, a chart, a second dataset (a subdataset) and a table that reads it. Time: about 20 minutes.
Before you start
You work in the Samples workspace: on the home screen, click View samples and tutorials (see
Totals and grouping). The data comes from the sample
database that Jaspersoft Desktop includes, through the data adapter Sample Database.jrdax at the
top of the workspace. The sample database describes its tables; this tutorial
uses its view SALES, one row per order line with the customer, the category and the amount.
If subdatasets are new to you, How a report works explains them in a few lines.
1. A report on an SQL query
- Choose Report in the explorer's + menu.
- Choose the template Simple Blue, then Next.
-
In Data Source, type
/Sample Database.jrdax(or pick it with the search button). The editor of the query opens below it. Type:SELECT CATEGORY, SUM(AMOUNT) AS SALES FROM SALES WHERE ORDER_YEAR = 2025 GROUP BY CATEGORY ORDER BY SALES DESC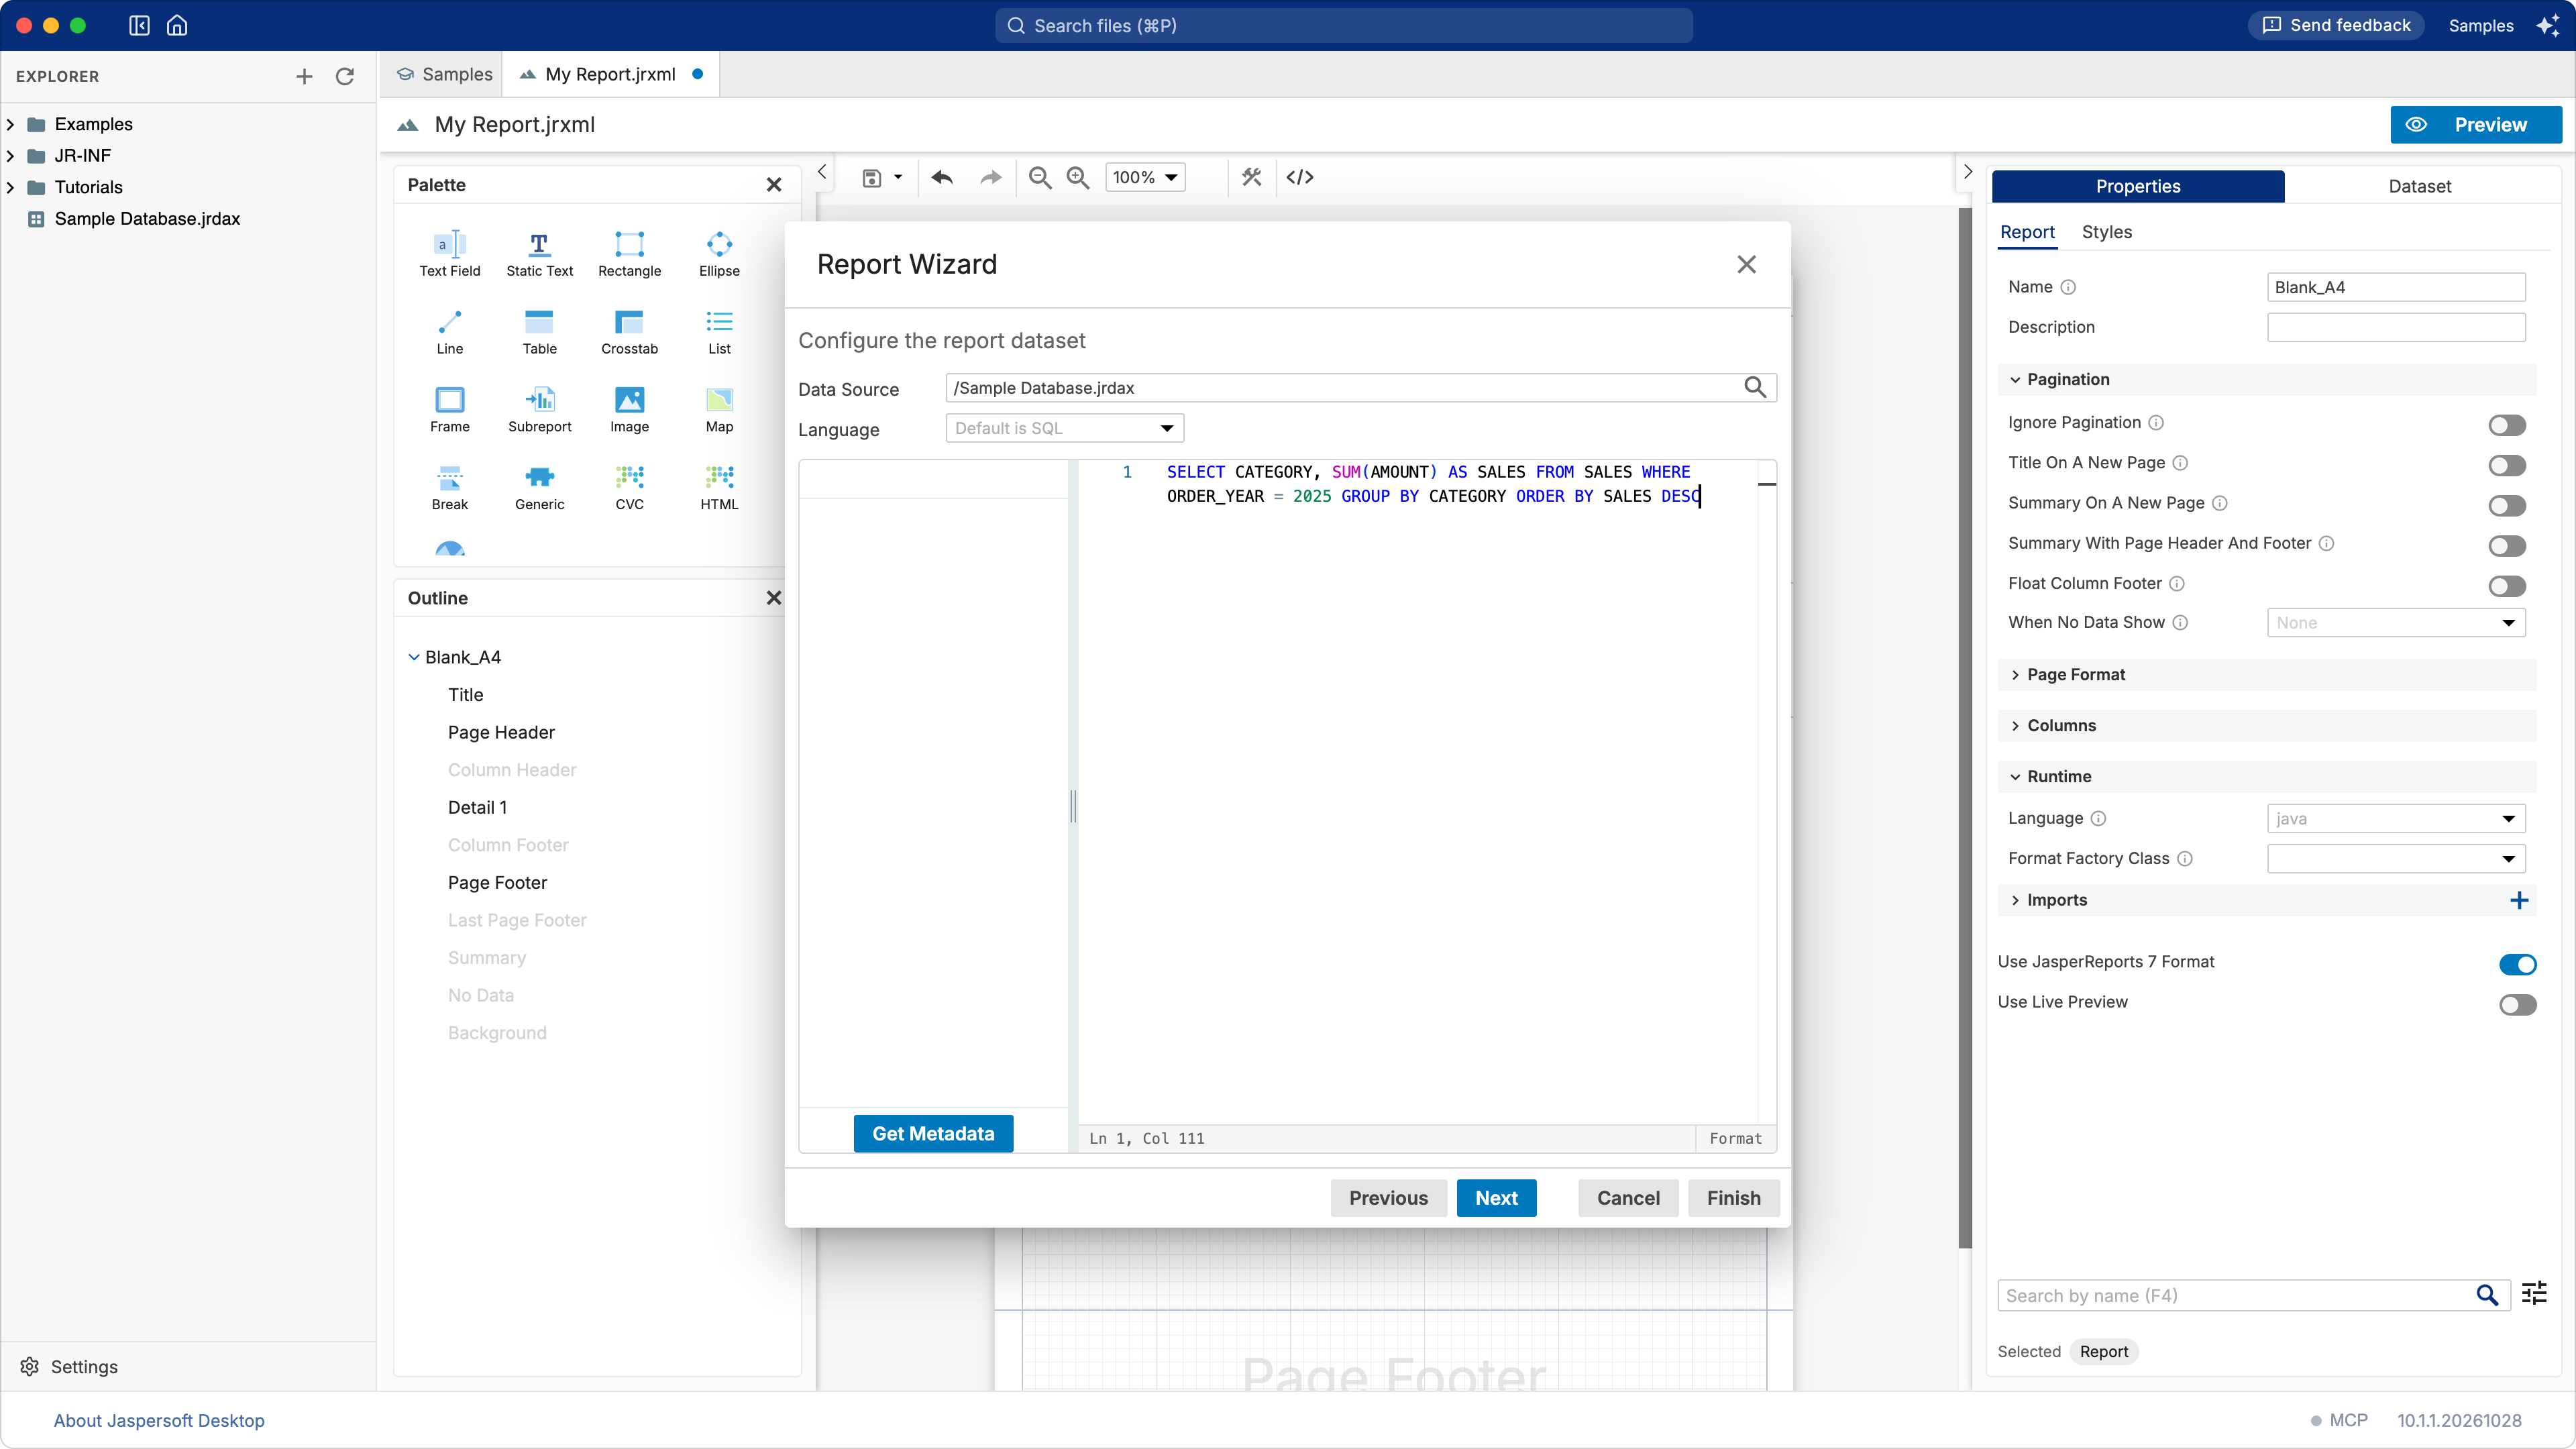
-
Click Next. Jaspersoft Desktop runs the query to learn its columns, the fields of the report:
CATEGORYandSALES. Double-click both, then click Finish.
The report prints one line per record of the query: eight categories with their sales.
2. A title, and room at the end
- Click TITLE on the page. In Properties, on the Static Text tab, set Text to
Sales 2025. - In the Outline, select Summary: the template leaves it empty, 0 high. Set its Height
to
480.
The Summary band prints once, after all the records: the place for a chart of them.
3. The chart
- In the Palette, under Charts, drag Chart onto the Summary band.
- Choose Bar Chart, then Next.
-
The chart reads the Main Dataset, the data of the report. Drag
"CATEGORY"onto Categories (X-Axis) and"SALES"onto Measures (Y-Axis): a bar for each category, as tall as its sales.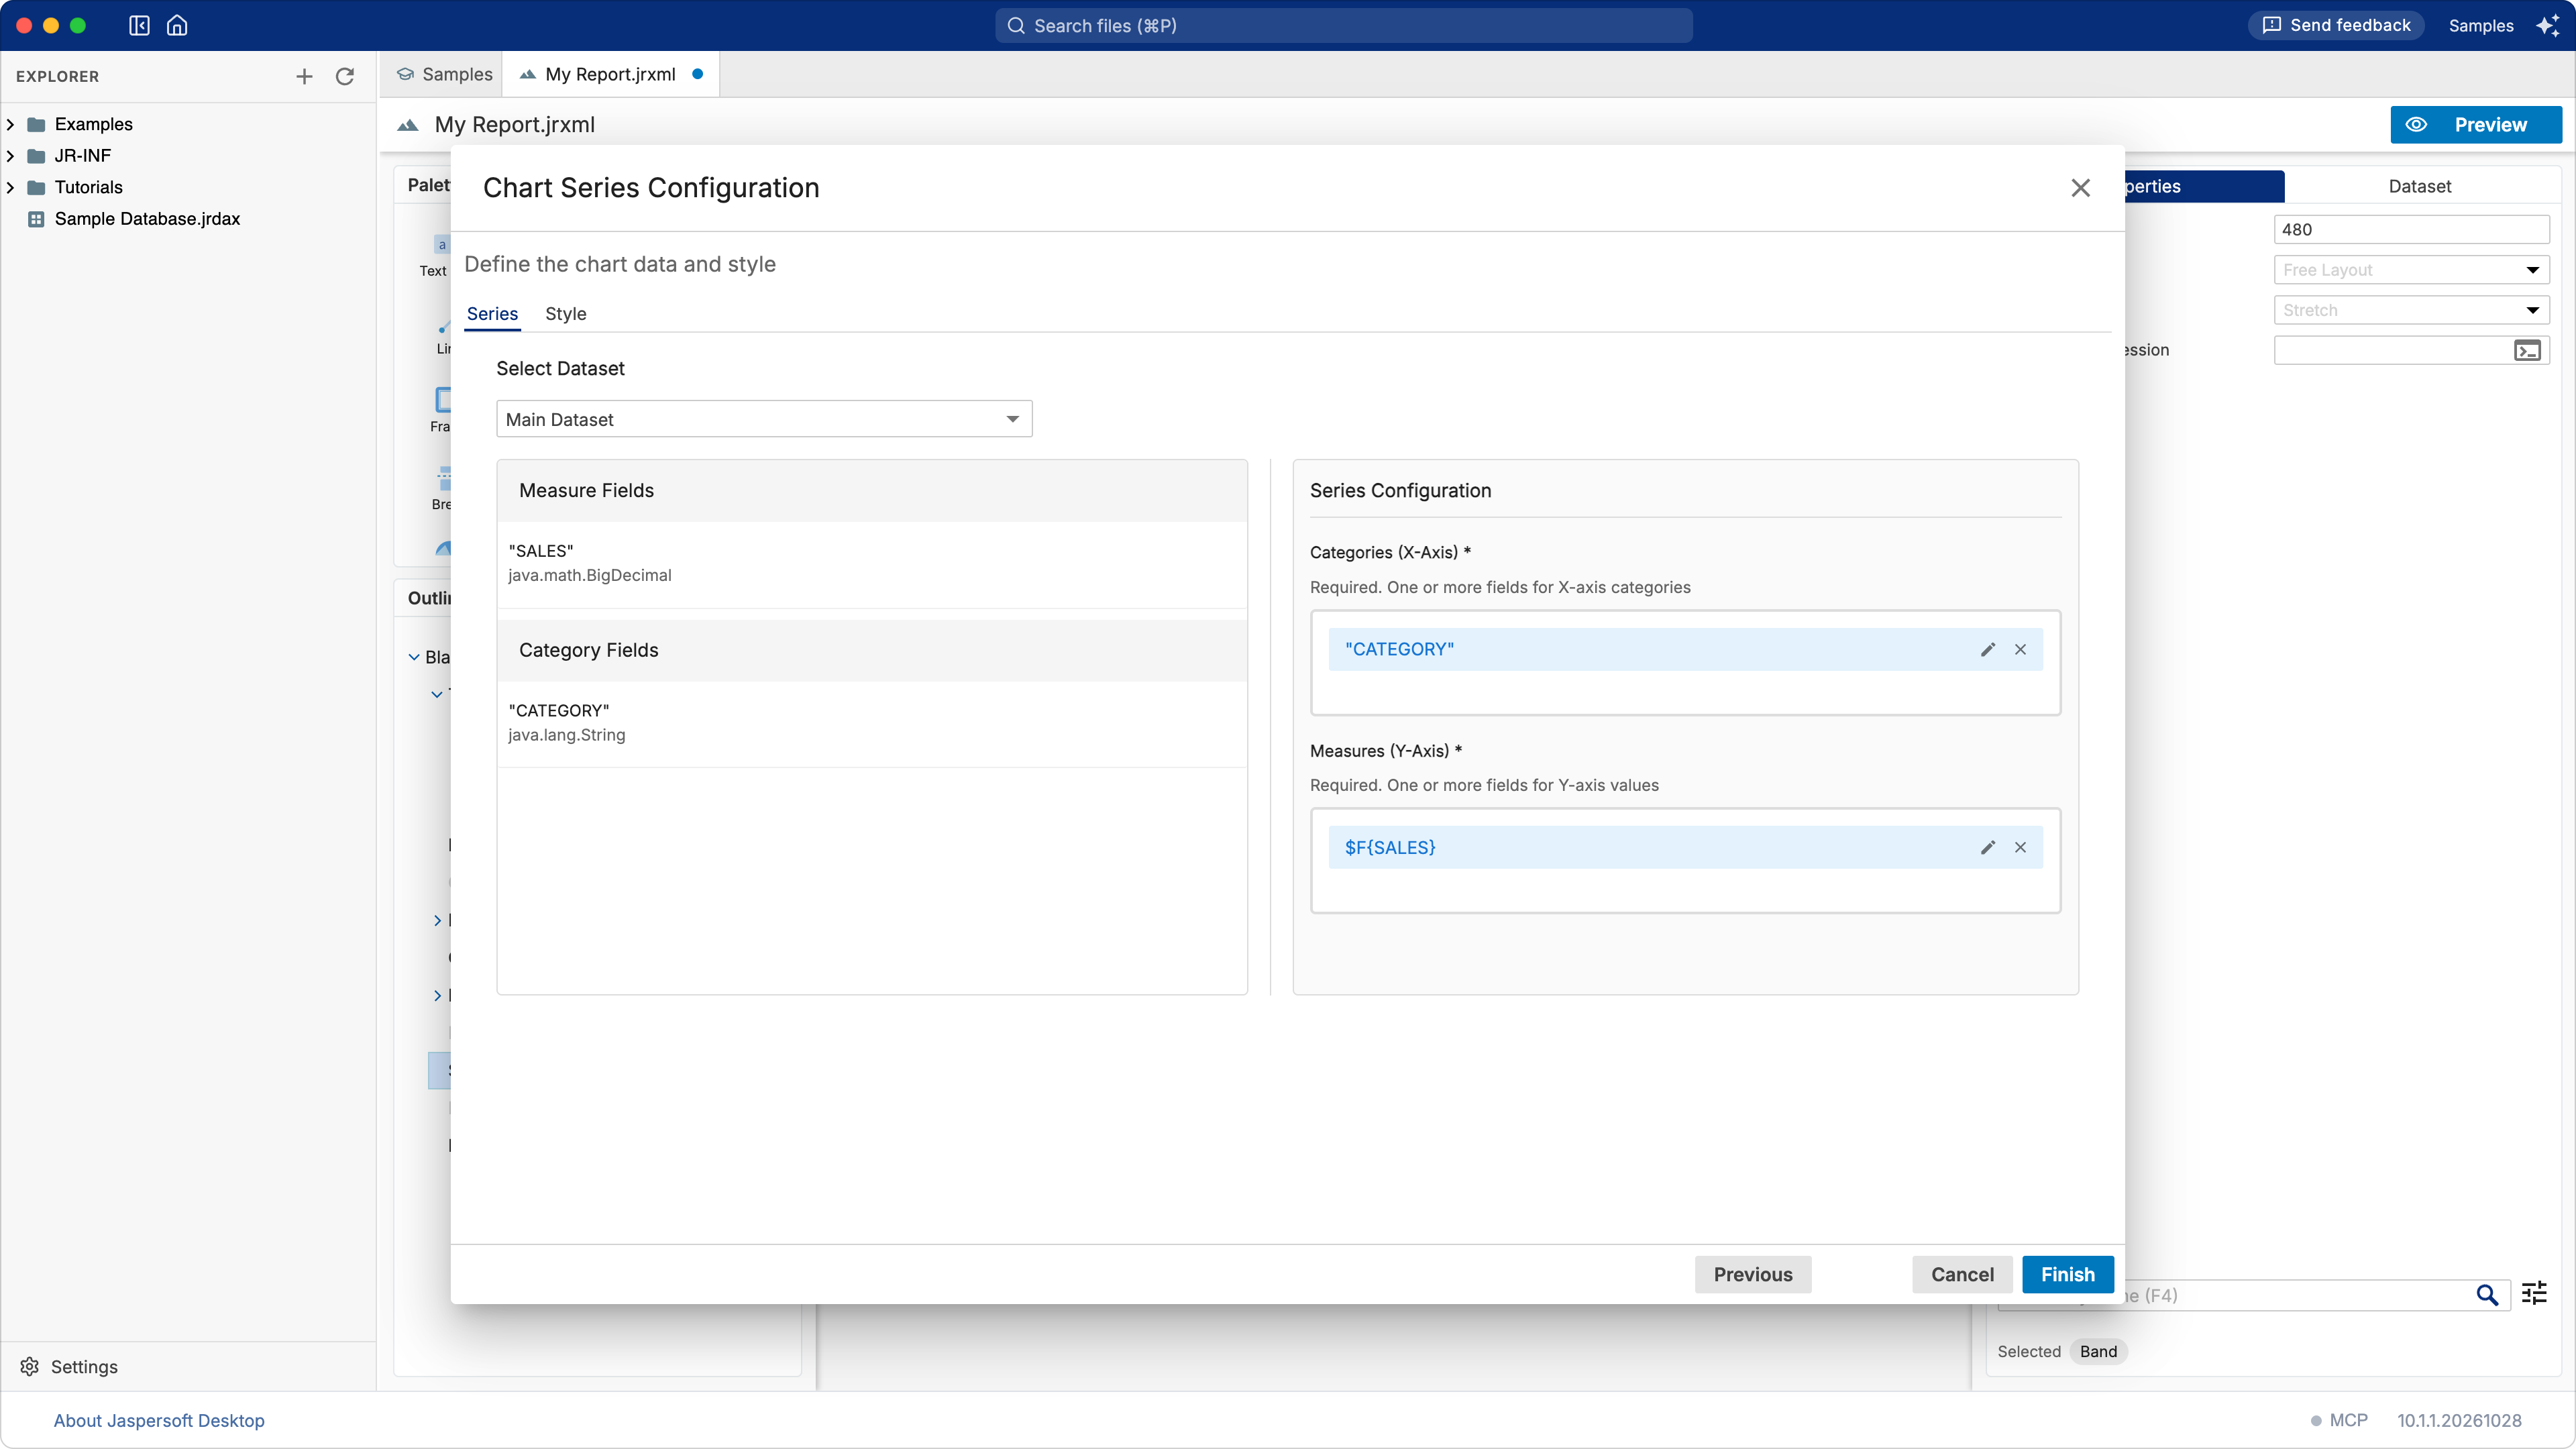
-
Click Finish. In the Outline, select Chart, and on the Appearance tab of Properties set Position X
0, Position Y10, Width555, Height240.
The chart collects the values of every record as the report goes, and draws them when it prints: in the Summary band, once, with all of them. The designer shows a sample chart in its place; the preview shows the real one.
4. A second dataset
The ten best customers are another query, which the report's dataset cannot answer: it returns categories. A subdataset is a dataset of its own inside the report, with its query and its fields, for a table, a chart or a list.
- Open the Dataset tab and click the + of Dataset: Main Dataset. A dataset named
Datasetis added to the list: select it. - Set its Name to
TopCustomersand its Data Adapter to/Sample Database.jrdax. -
Turn on Show Query Editor. The editor of the query takes the place of the page. Type:
-
Click Read Fields:
CUSTOMER,COUNTRYandSALESappear under Fields. Click Preview Data to see the first records.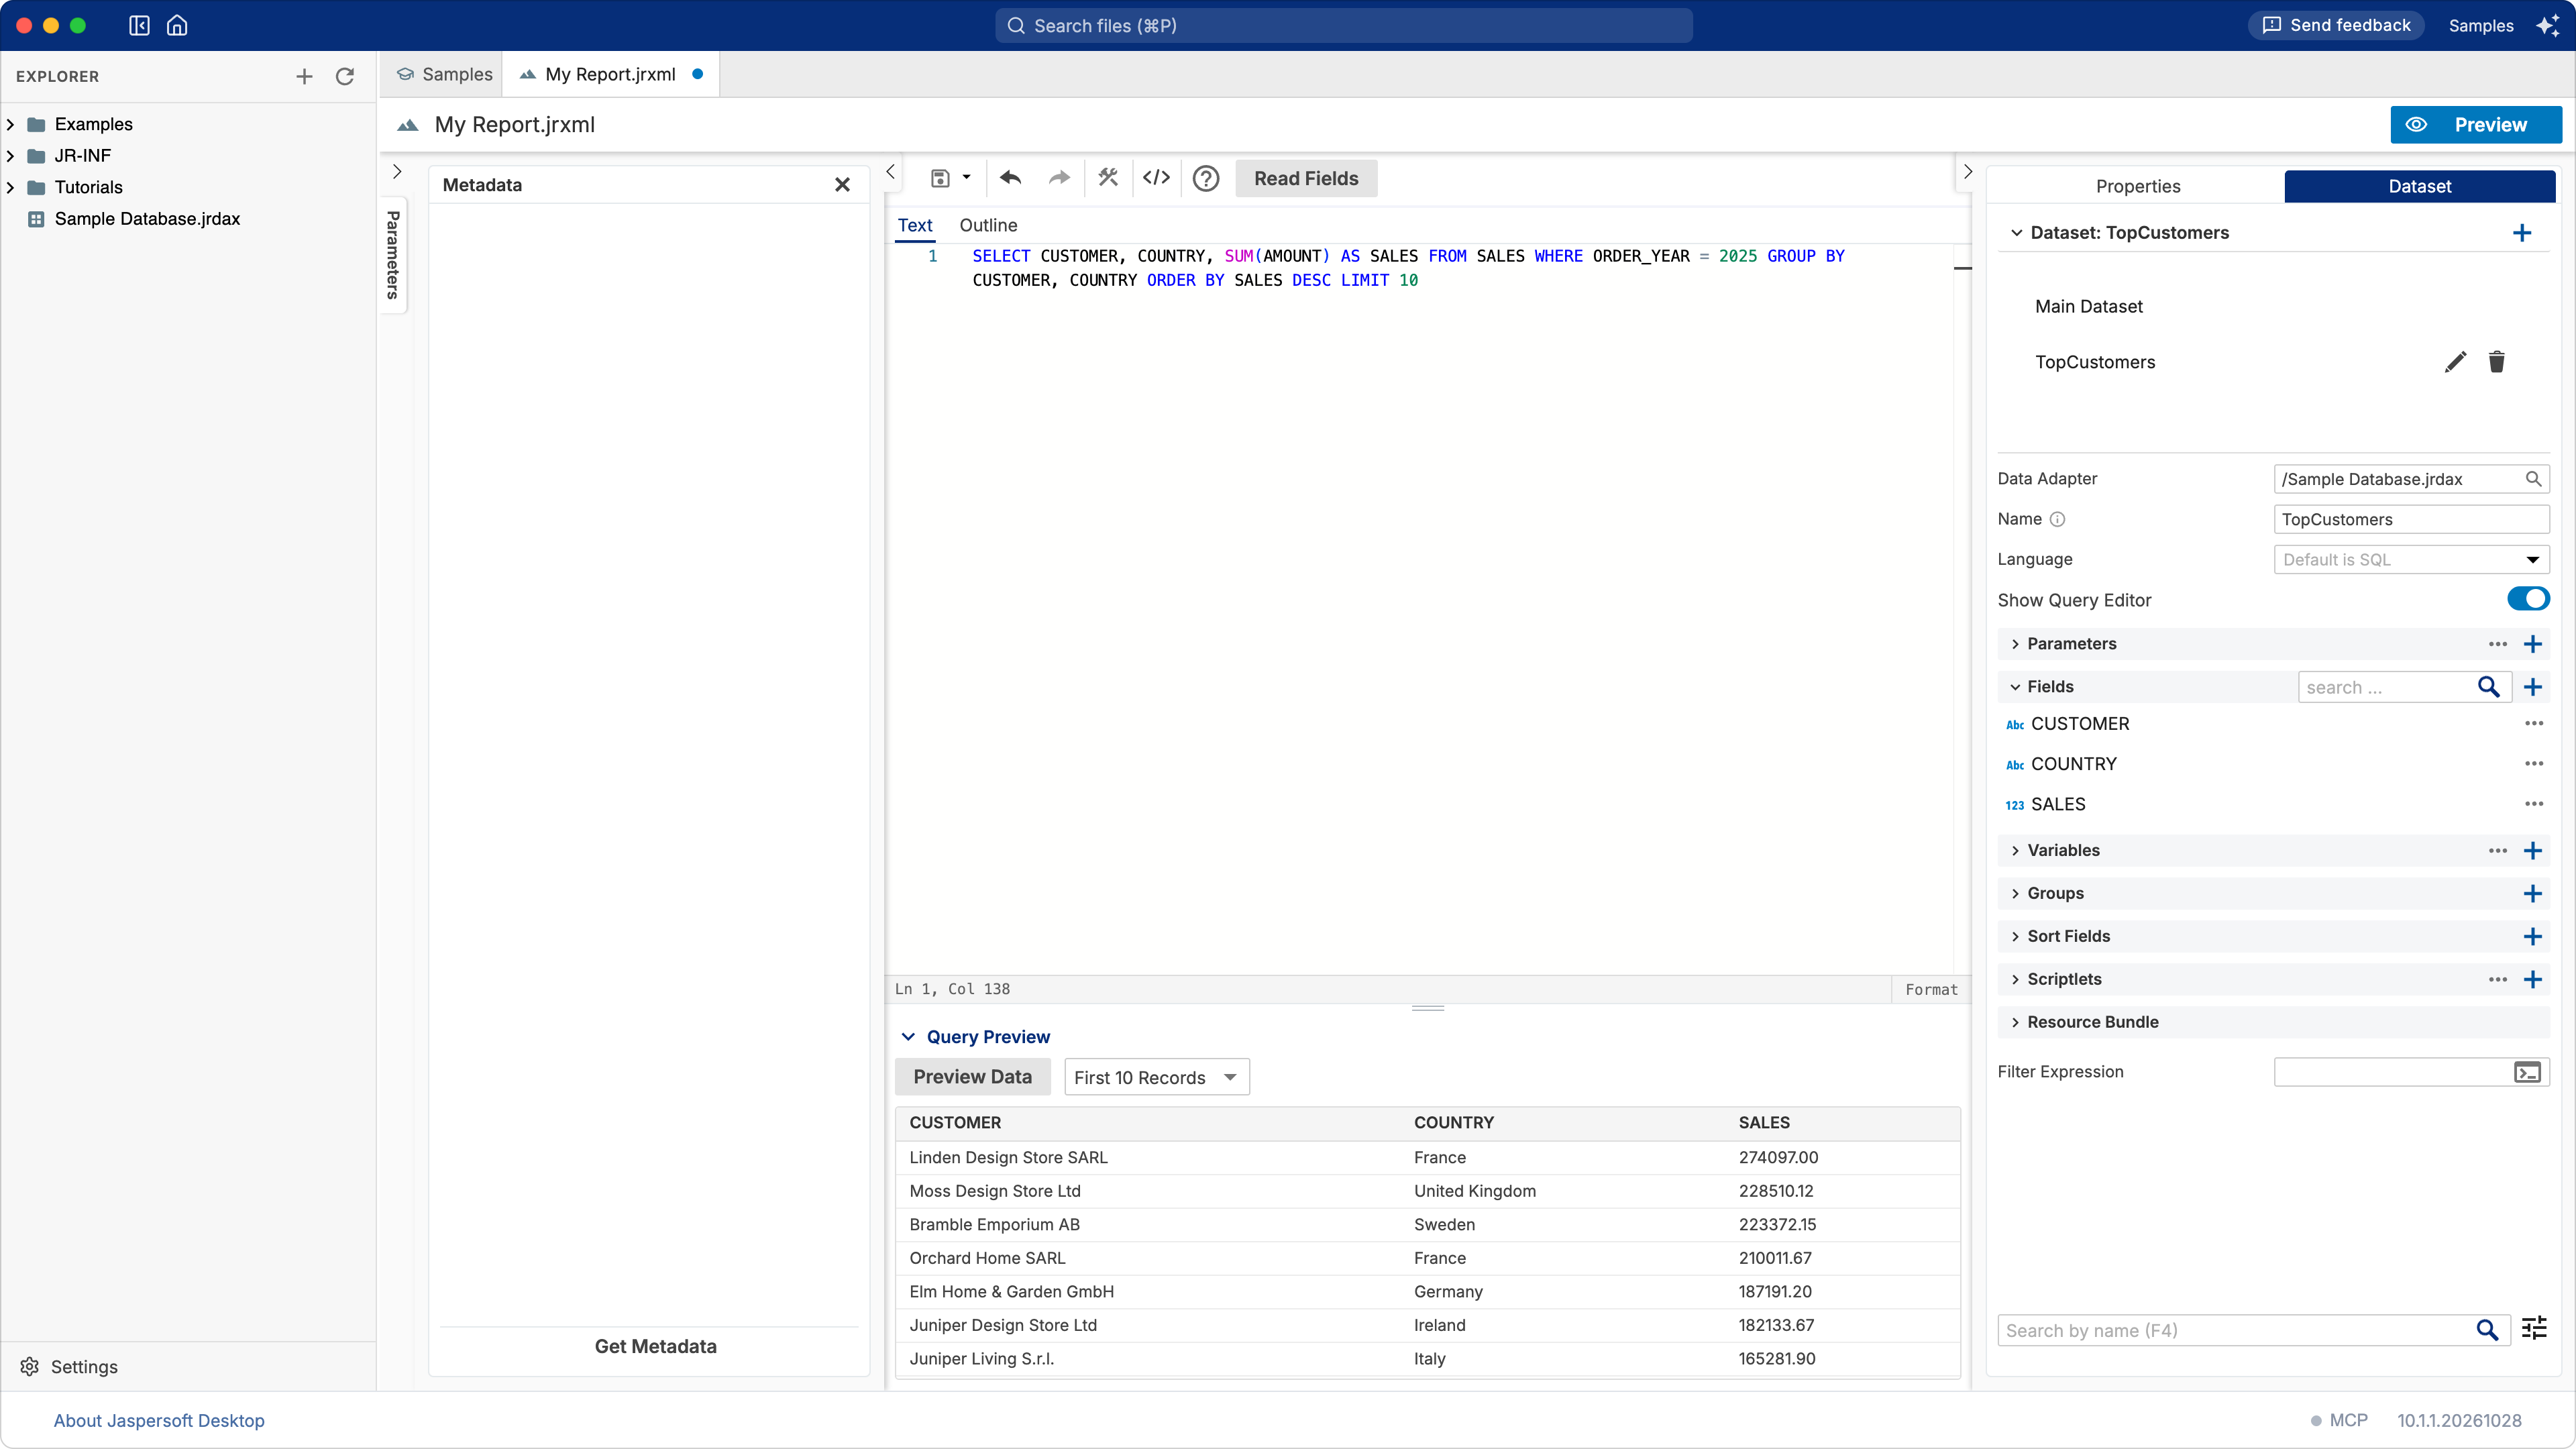
-
Turn Show Query Editor off, to see the page again.
5. The table
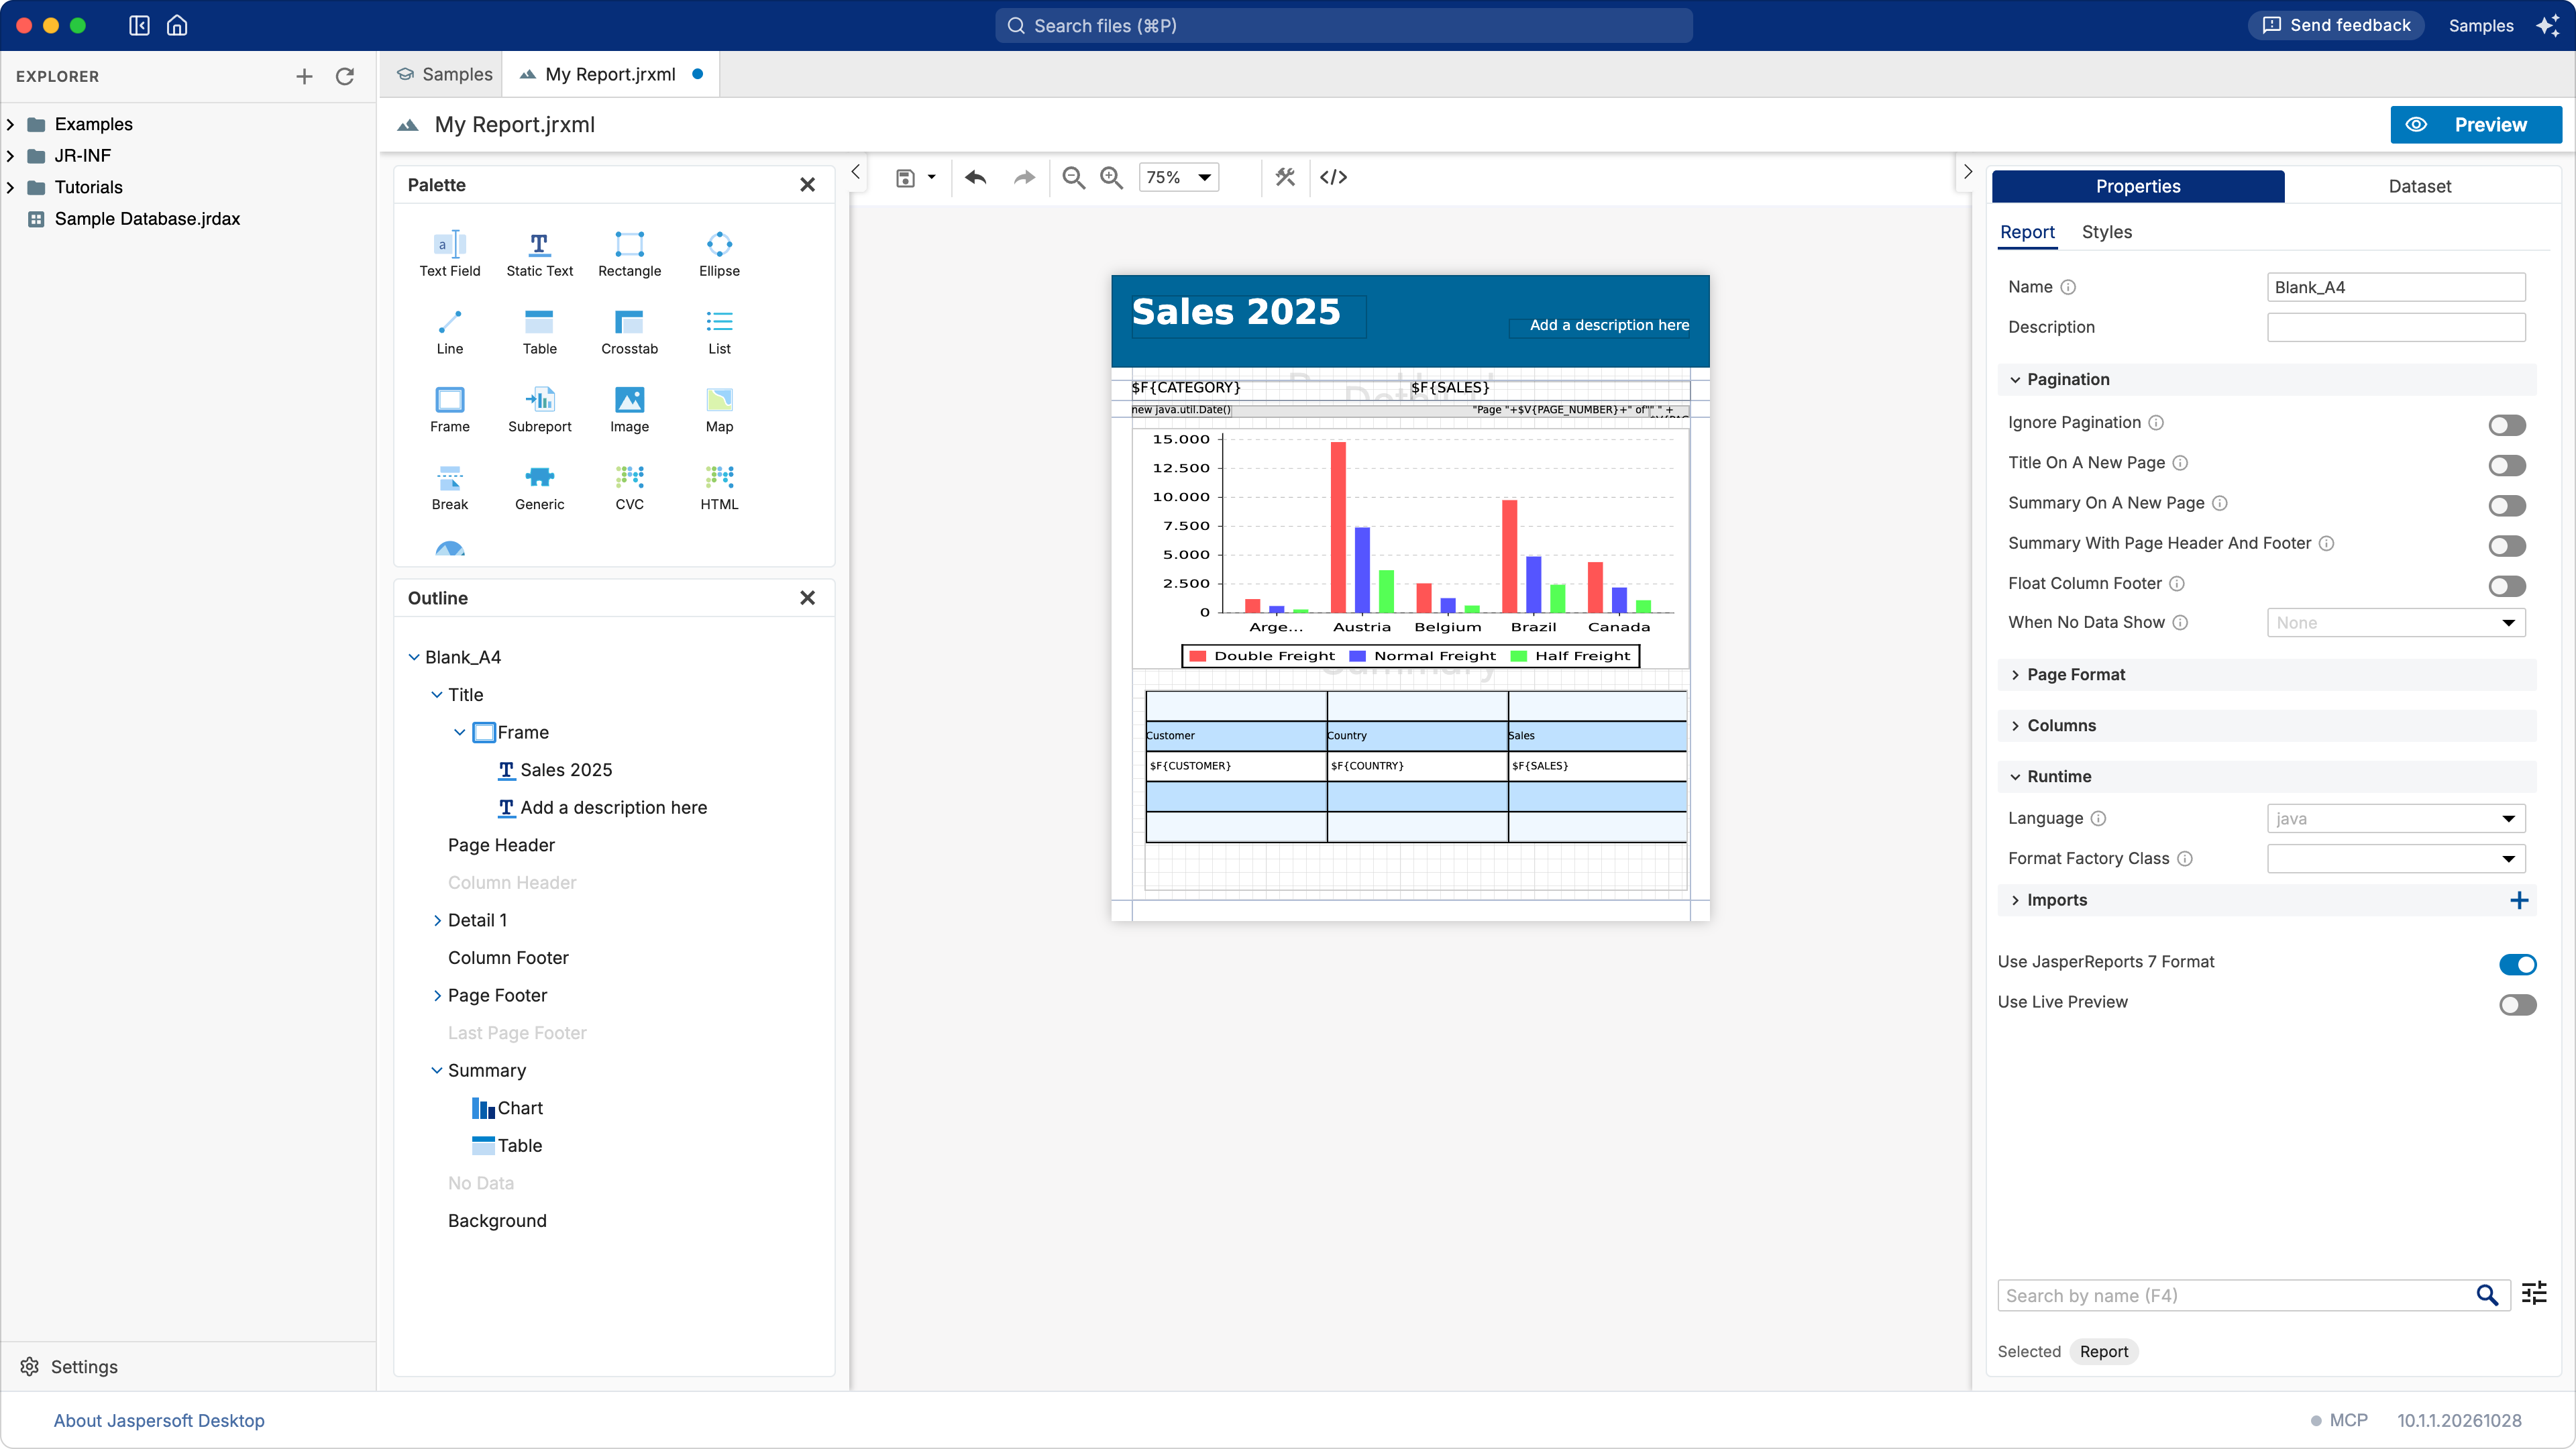
- Drag Table from the Palette onto the Summary band, near its left edge, under the chart. The columns of a new table share the width of the page from where you drop it.
-
The Table Wizard asks which dataset fills the table: choose TopCustomers. Leave Connection as it is, Use the same JDBC connection used to fill the master report: the table runs its query on the database the report reads, through
$P{REPORT_CONNECTION}.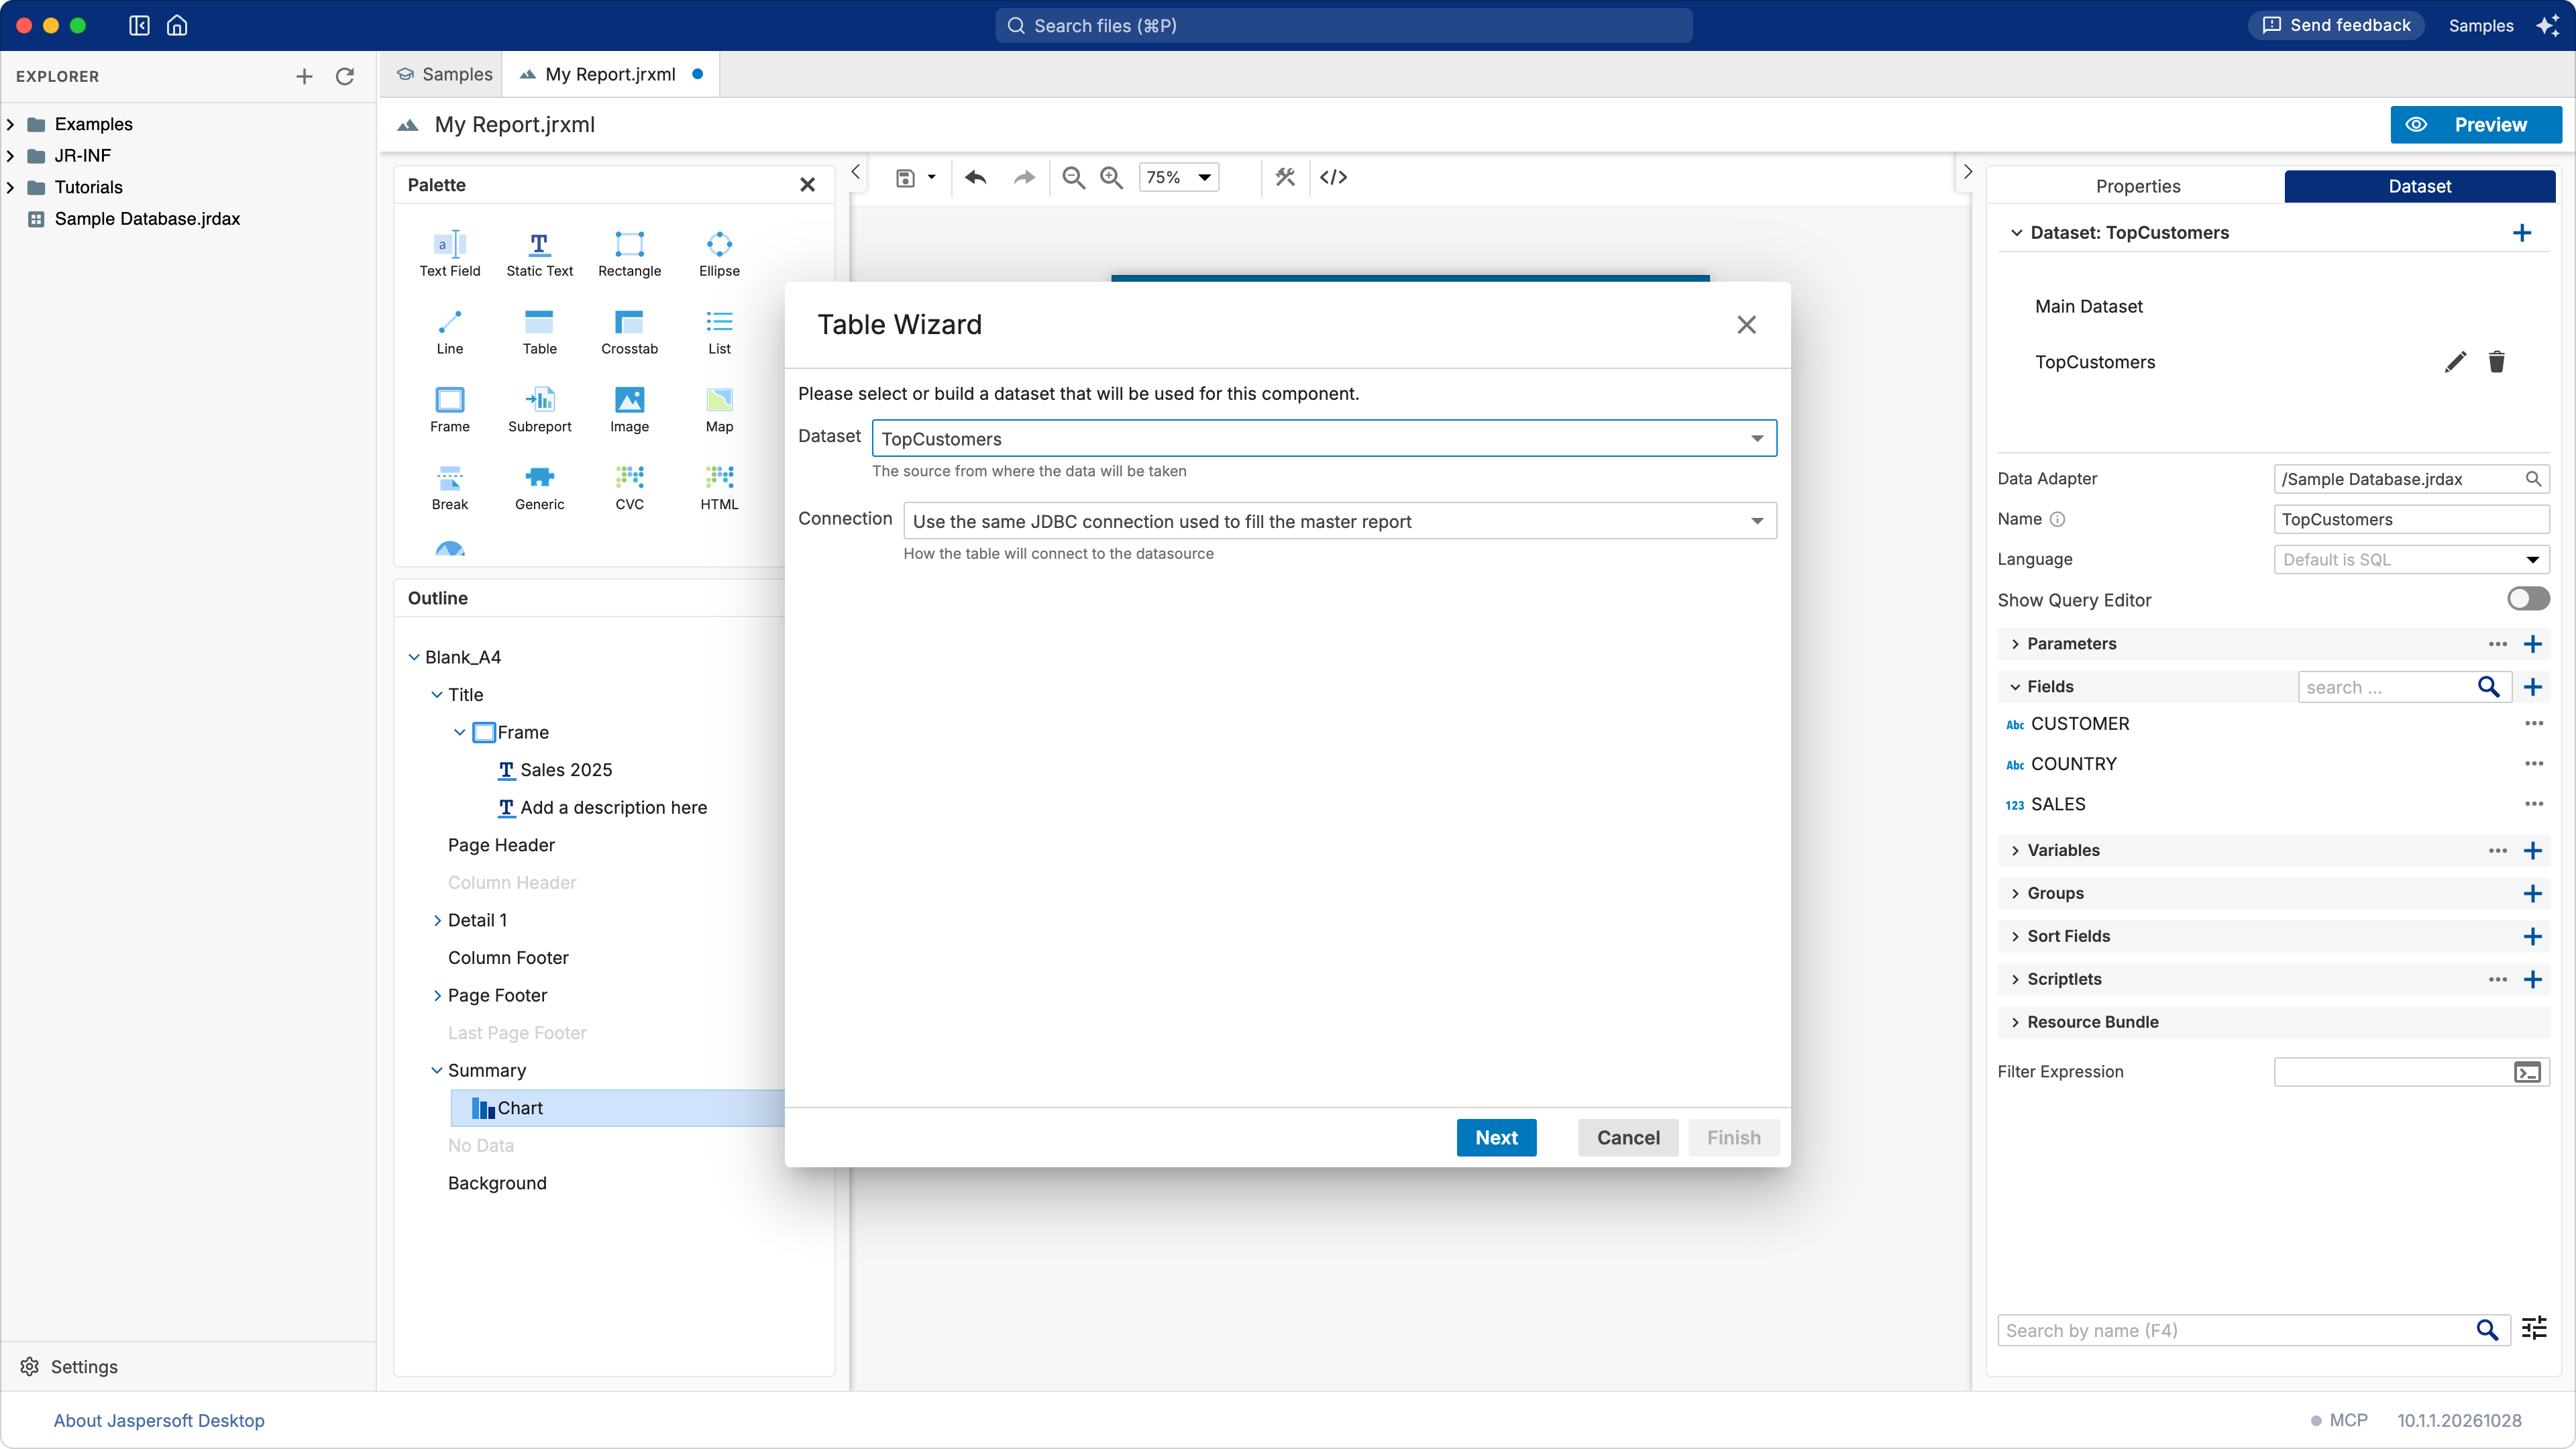
-
Click Next, then ≫ to make a column of each field, then Next and Finish.
- In the Outline, select Table, and on the Appearance tab set Position X
0and Position Y270: under the chart.
6. Save and preview
Save the report (the save button of the toolbar) as Sales Overview.jrxml, then click Preview:
the categories, their chart, and the ten customers who bought most in 2025, Linden Design Store
SARL first.
Going further
- Format the amounts. Select a text field of
SALES(in the detail band, or in the table's detail cell) and set its Pattern to#,##0.00. - Another kind of chart. A Pie Chart shows the same series as shares of the whole.
- A year chosen when the report runs. A parameter
Yearin the report, used in its query (WHERE ORDER_YEAR = $P{Year}), and passed on to the subdataset by the table's dataset run (its Parameters, in the table's properties), so that both answer for the same year. See A filter with parameters.
What you learned
- A report reads an SQL query through a JDBC data adapter; the wizard makes the fields of its columns.
- A chart collects the values of every record; in the Summary band it draws them all.
- A subdataset is a second query in the report, for an element of its own: here a table.
- A table on a subdataset of the same database runs its query on the report's connection.