Tutorial: totals and grouping
What you build: the sales report grouped by country gets a total for each country and a grand total at the end. What you learn: bands that are not in the report yet, variables, how a total starts again at each group, and placing an element precisely. Time: about 15 minutes.
Before you start
You work in the Samples workspace, which comes with Jaspersoft Desktop. On the home screen,
click View samples and tutorials. The first time, Jaspersoft Desktop copies the samples into your
Documents folder, Documents/Jaspersoft Desktop/Samples, and opens them; the copy is yours to
change. In the explorer, open the Tutorials folder, then Sales by Country.jrxml: the report,
grouped by country. It reads sales.csv through its data adapter, Sales.jrdax, both in the same
folder.
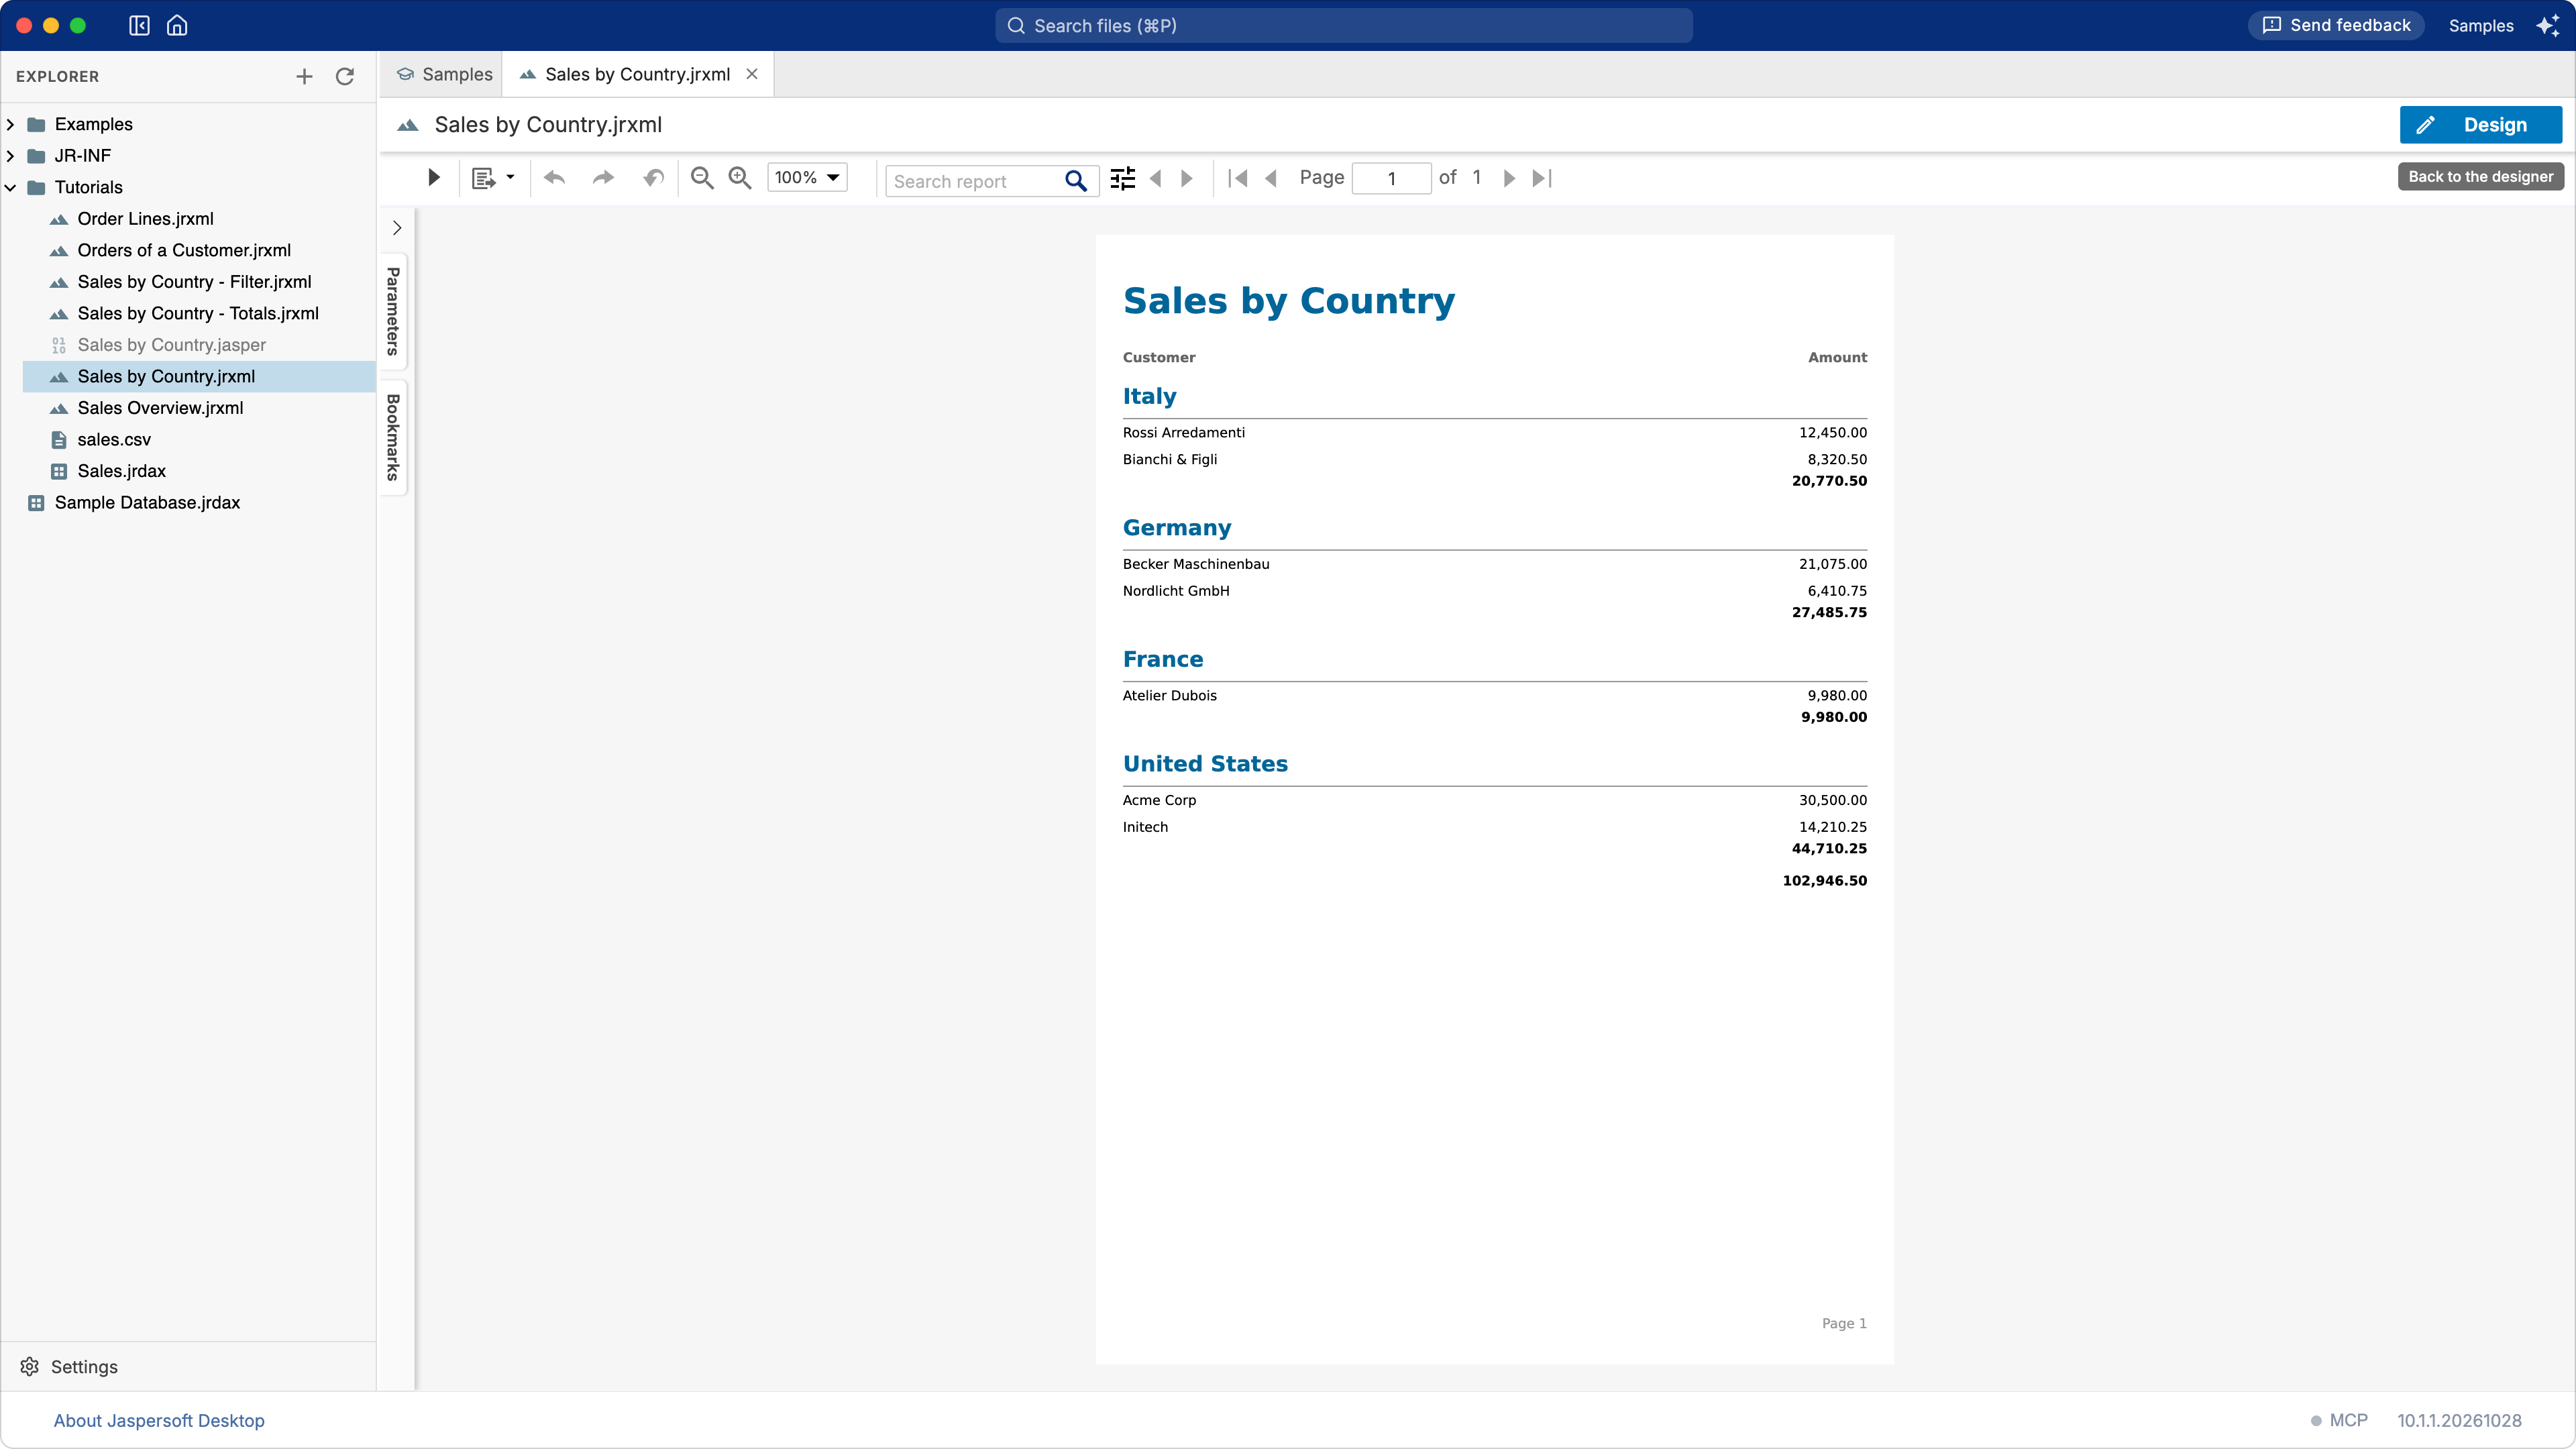
Click Preview if you want to see the report as it is: a section for each country, with its customers and amounts.
If some of the words below are new to you (bands, fields, variables, groups), read How a report works first: it takes five minutes.
1. The grand total
A grand total is printed once, at the end of the report: its place is the Summary band.
- In the Outline, on the left, Summary is grey: the report has no summary band yet. Point at it and click the + (Create Band) at the end of its row. The band appears on the page.
- Open the Dataset tab, at the right of Properties, and expand Fields.
- Drag the field amount onto the Summary band, on the page.
Jaspersoft Desktop knows that the amount of one record means nothing in the summary, so it asks what to compute with it, in the Calculation Configuration Wizard. Choose Sum, then click Finish.
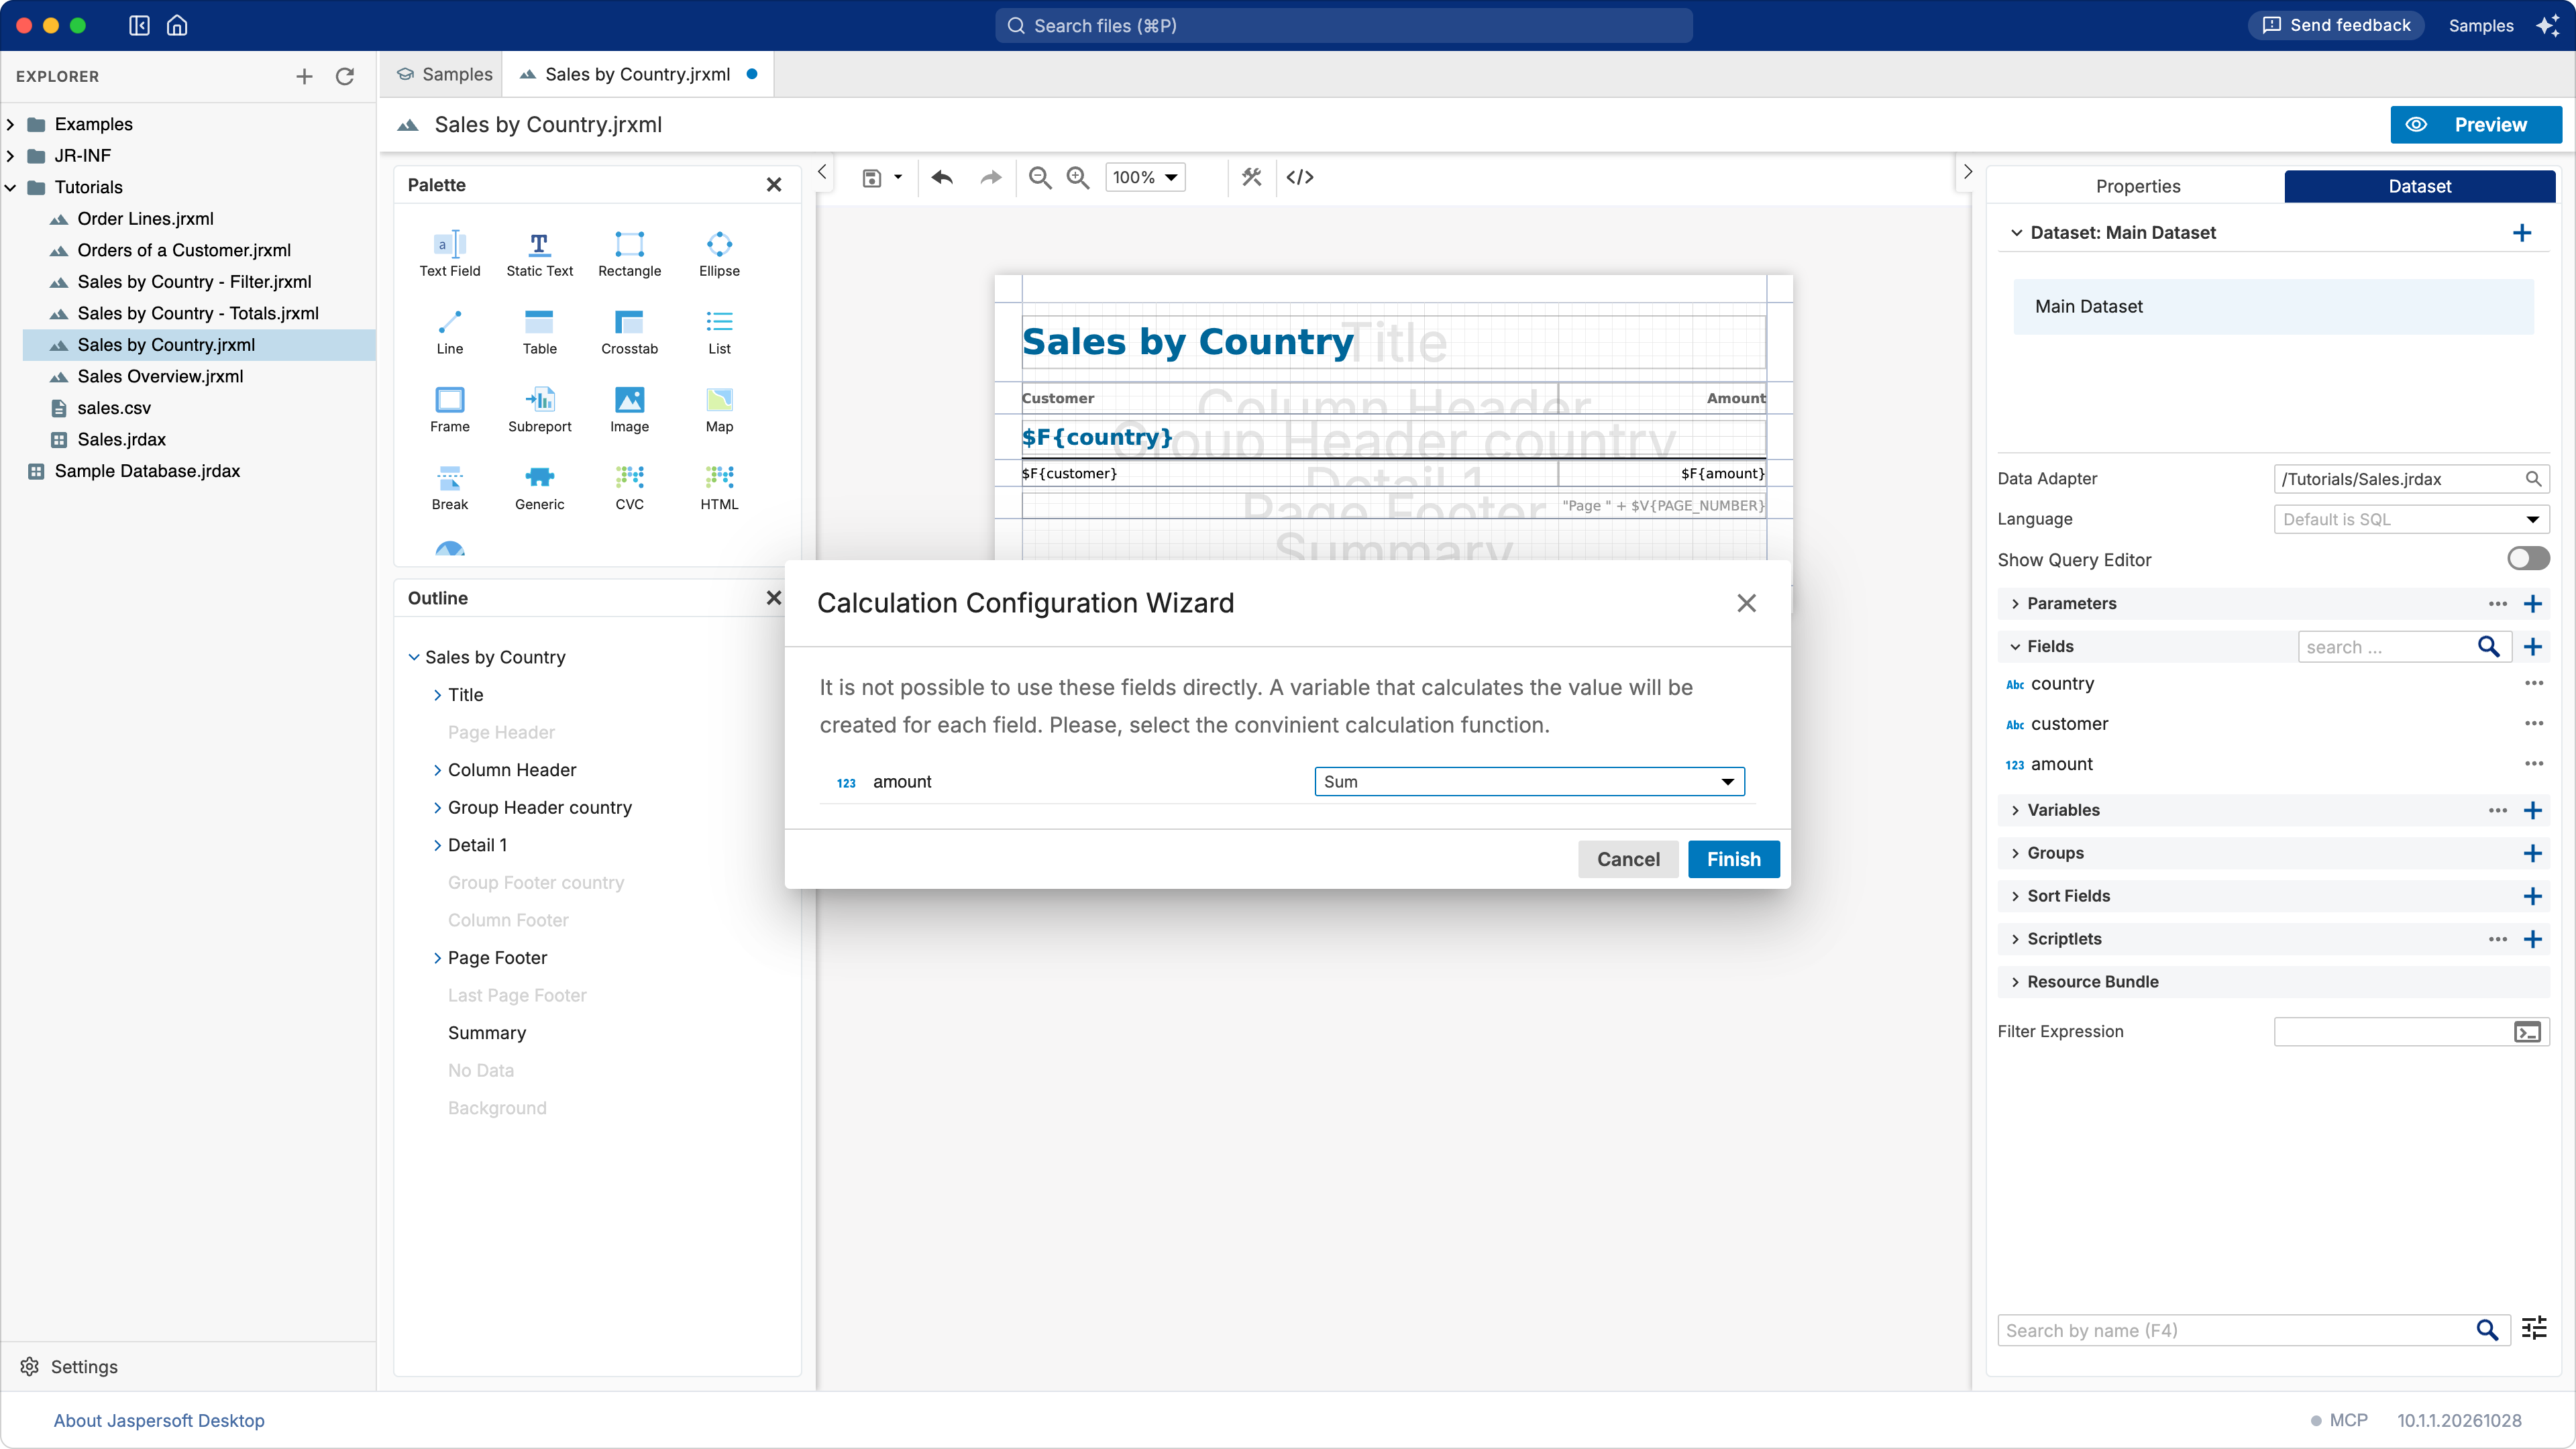
This creates two things: a variable, amount_SUM, that adds up the amounts as the report
goes, and a text field in the summary band that shows it, $V{amount_SUM}. You find the
variable in Variables, in the Dataset tab.
2. A total for each country
The total of a country goes at the end of the country's section: in the Group Footer country band.
-
In the Outline, point at Group Footer country (grey) and click its +.
Now the total. You could drag amount onto the group footer as before, but a variable made by the wizard adds up from the beginning of the report (its Reset On is Report): in the footer of the second country it would show the total of the first two. A total for each country must start again at each country. So this time you create the variable yourself:
-
In the Dataset tab, expand Variables and click its +. A variable named
Variableis added. -
Right-click it and choose Edit. In the editor that opens, set:
Property Value Why Name country_totalThe name you will use in the report. Class java.math.BigDecimalThe kind of value: the amounts are decimal numbers. Calculation Sum Add up… Expression $F{amount}…the amount of each record. Reset On Group - country Start again from zero at each country. 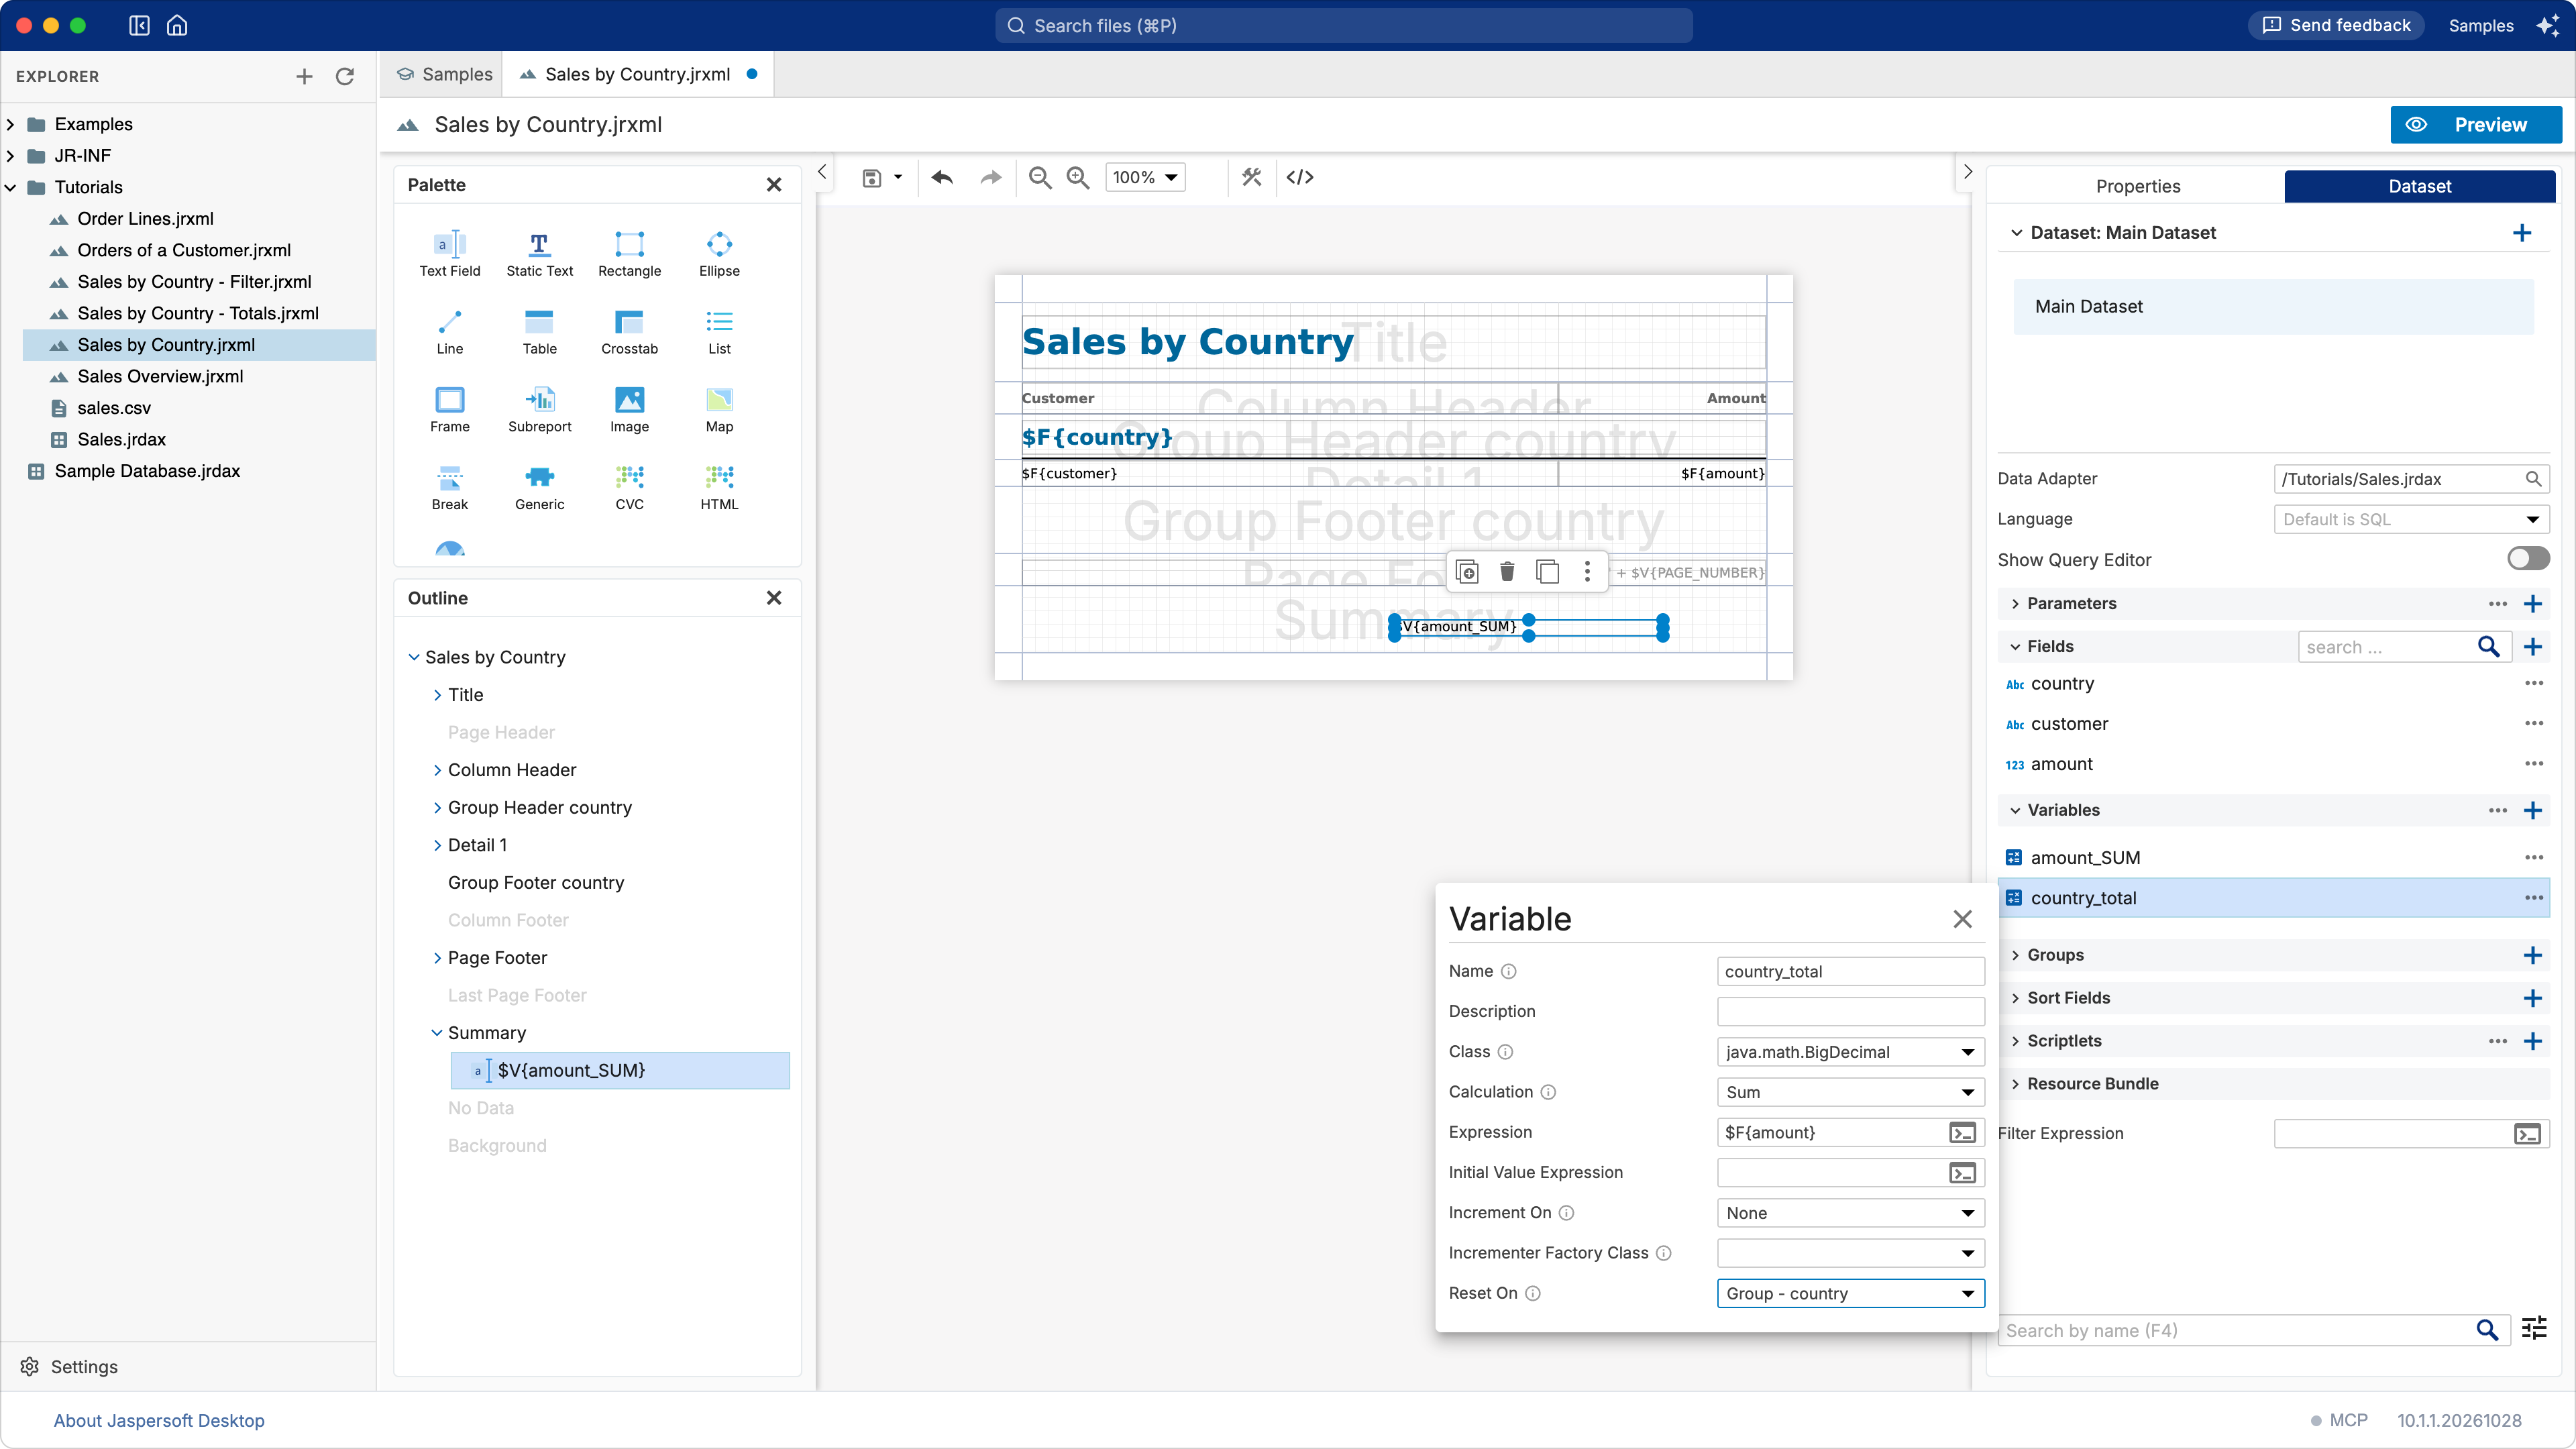
Changes apply as you make them: close the editor with its ×.
-
From the Palette, drag a Text Field onto the Group Footer country band.
-
With the new text field selected, open Properties, then its Text Field tab. In Expression, replace
"Text Field"with$V{country_total}.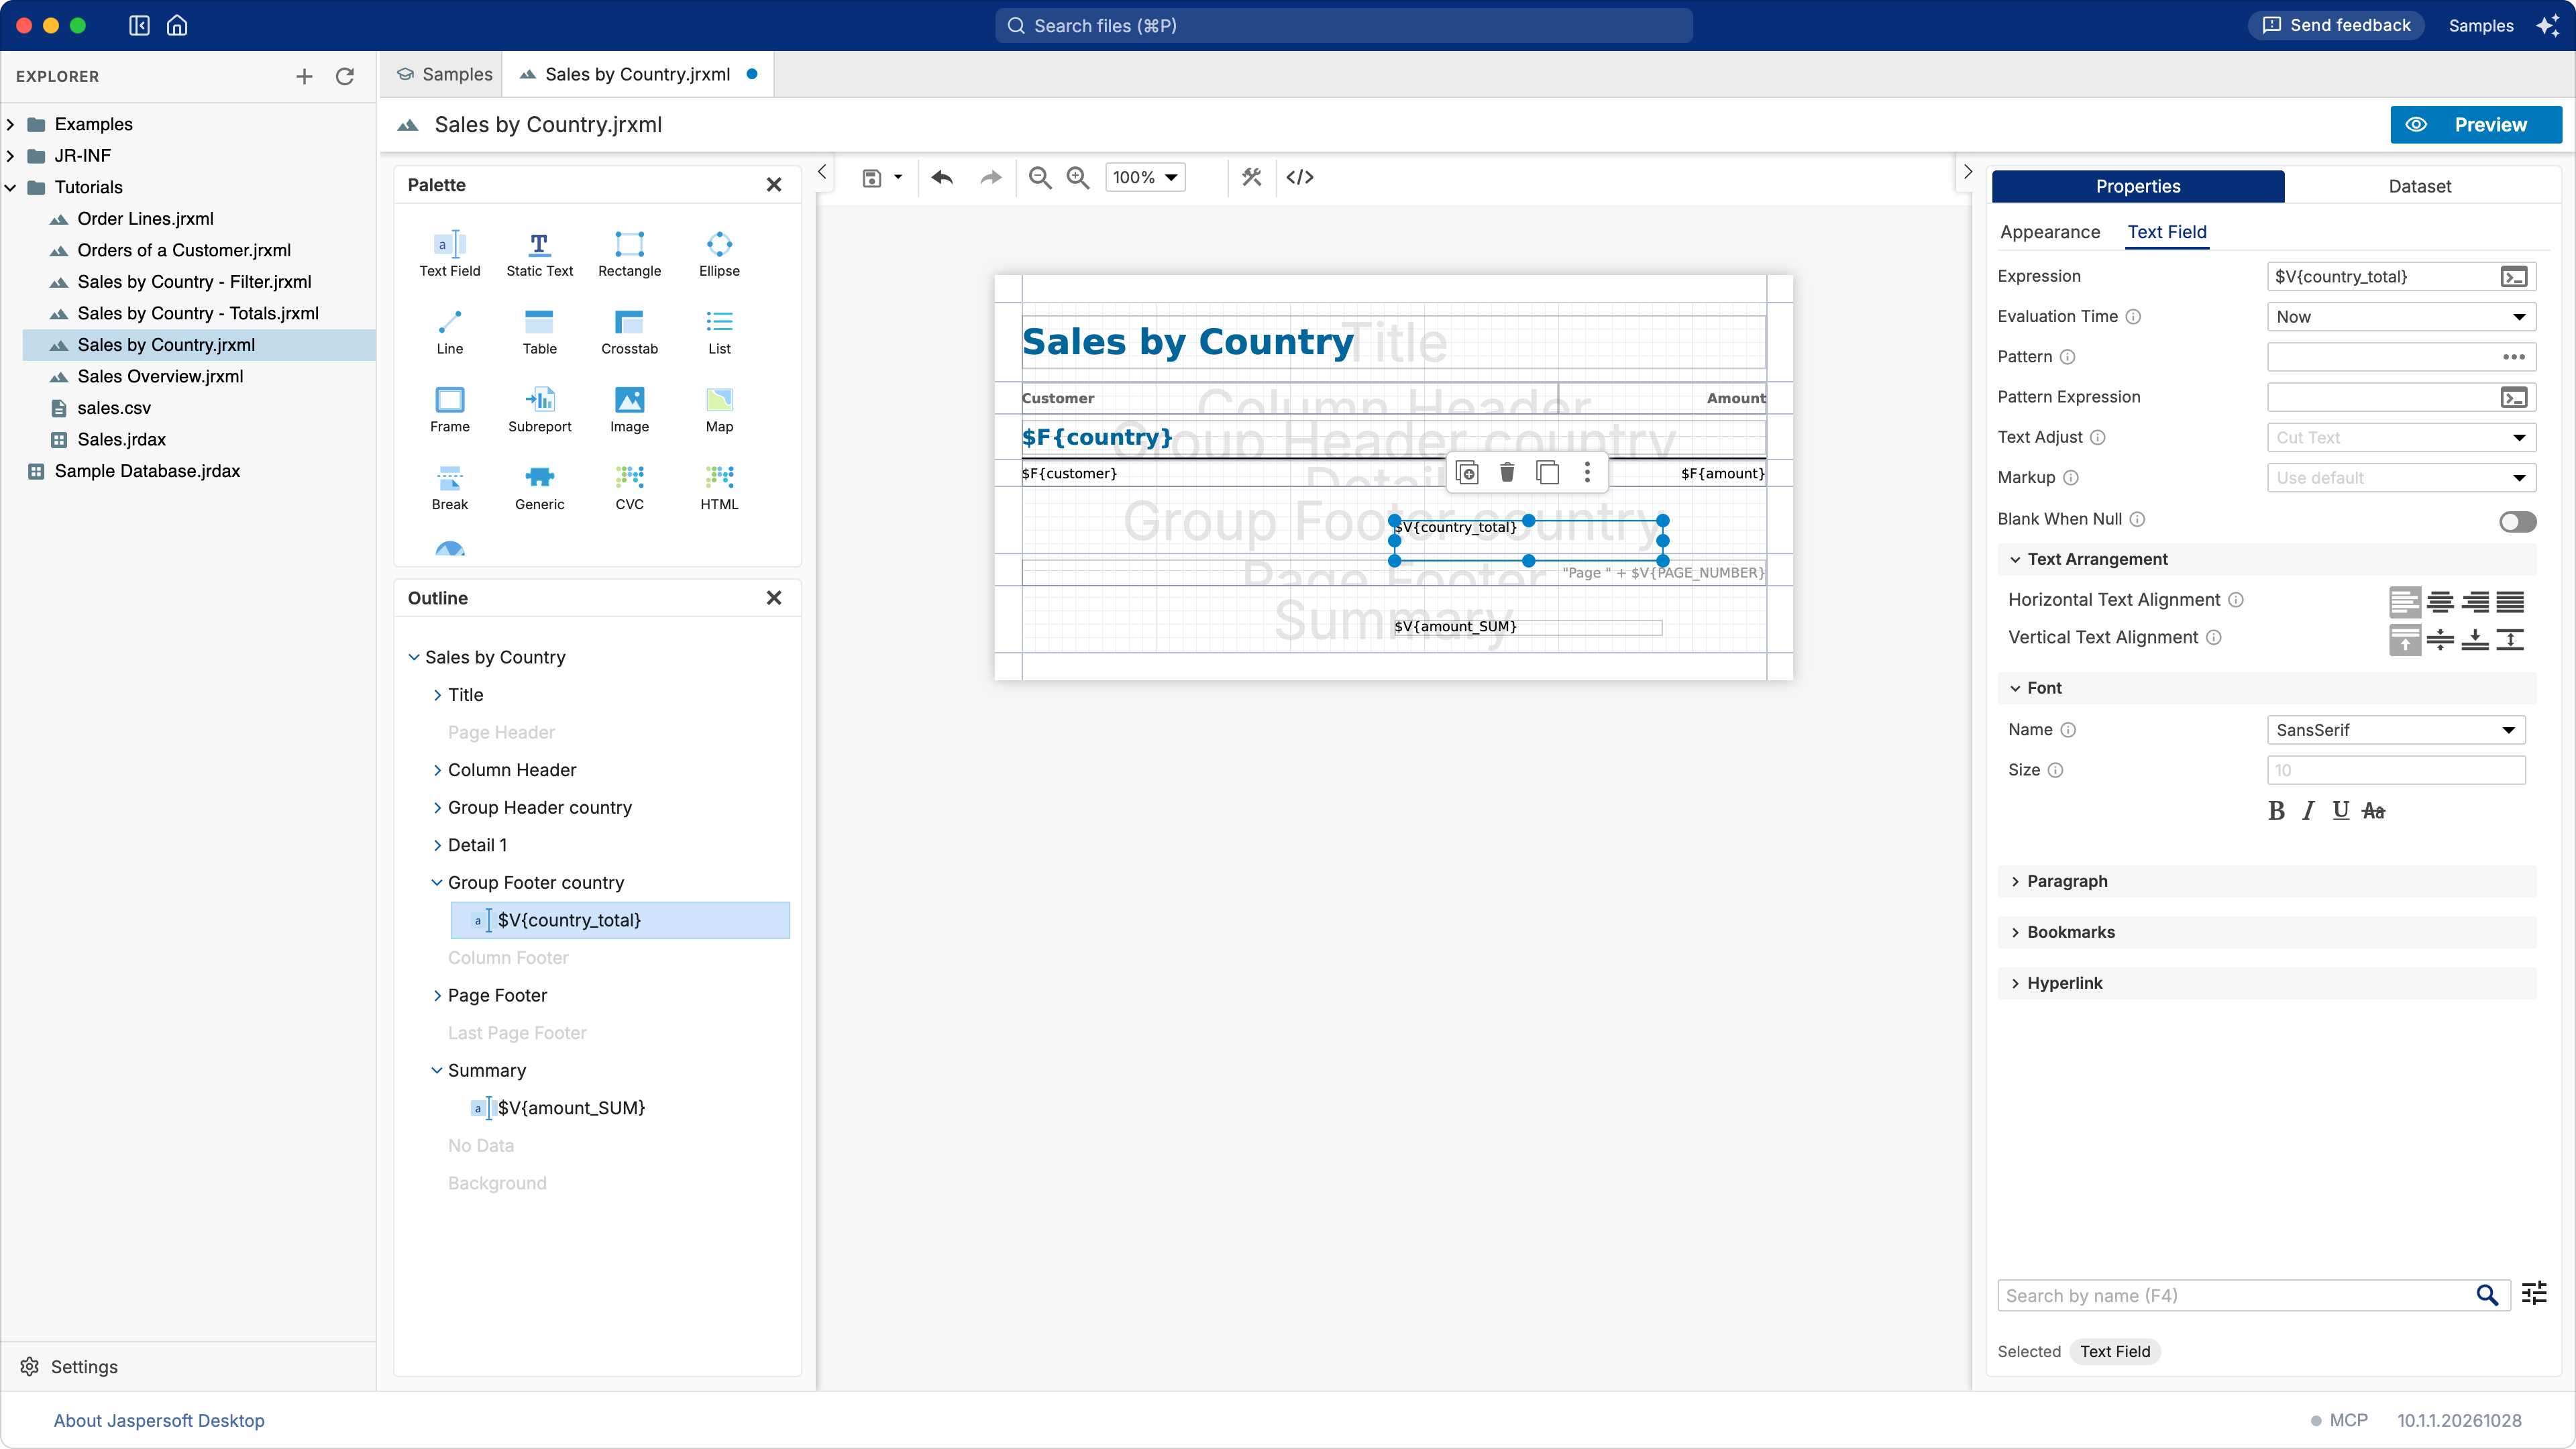
3. Put the totals in their place
The two totals should sit under the Amount column, formatted as the amounts are. For each of them (select it on the page, or in the Outline):
- On the Appearance tab of Properties: Position X
400, Position Y0, Width155, Height20: the place and the size of the Amount column. - On the Text Field tab:
- Pattern
#,##0.00, the format of the amounts above; - under Text Arrangement, Horizontal Text Alignment: right;
- under Font, Bold.
- Pattern
An element must fit inside its band. If one reaches below the bottom of its band (dropped too low, or too tall), the preview refuses the report with "Element bottom reaches outside band area": move it up, or make it shorter.
Finally, select Group Footer country in the Outline and set its Height to 24, so that
the band is not taller than its total.
4. Preview
Click Preview. Under each country you see its total (Italy: 20,770.50), and the grand total at the end: 102,946.50. Save the report: ⌘S (Ctrl+S on Windows and Linux), or the save button of the toolbar.
What you learned
- A band that is grey in the Outline is not in the report yet: + creates it.
- Dropping a field outside the detail band asks what to compute, and creates a variable.
- A variable's Reset On decides where its count starts again: Report for a grand total, a group for a subtotal.
- Properties places an element exactly, and formats what it shows.
Starting again from the samples
Jaspersoft Desktop never overwrites your copy of the samples. To get the original files back,
close the workspace, then delete or rename the Samples folder in Documents/Jaspersoft Desktop;
the next click on View samples and tutorials copies them again.
Next: A filter with parameters.