Creating a Monitor
Starting Monitor Creation
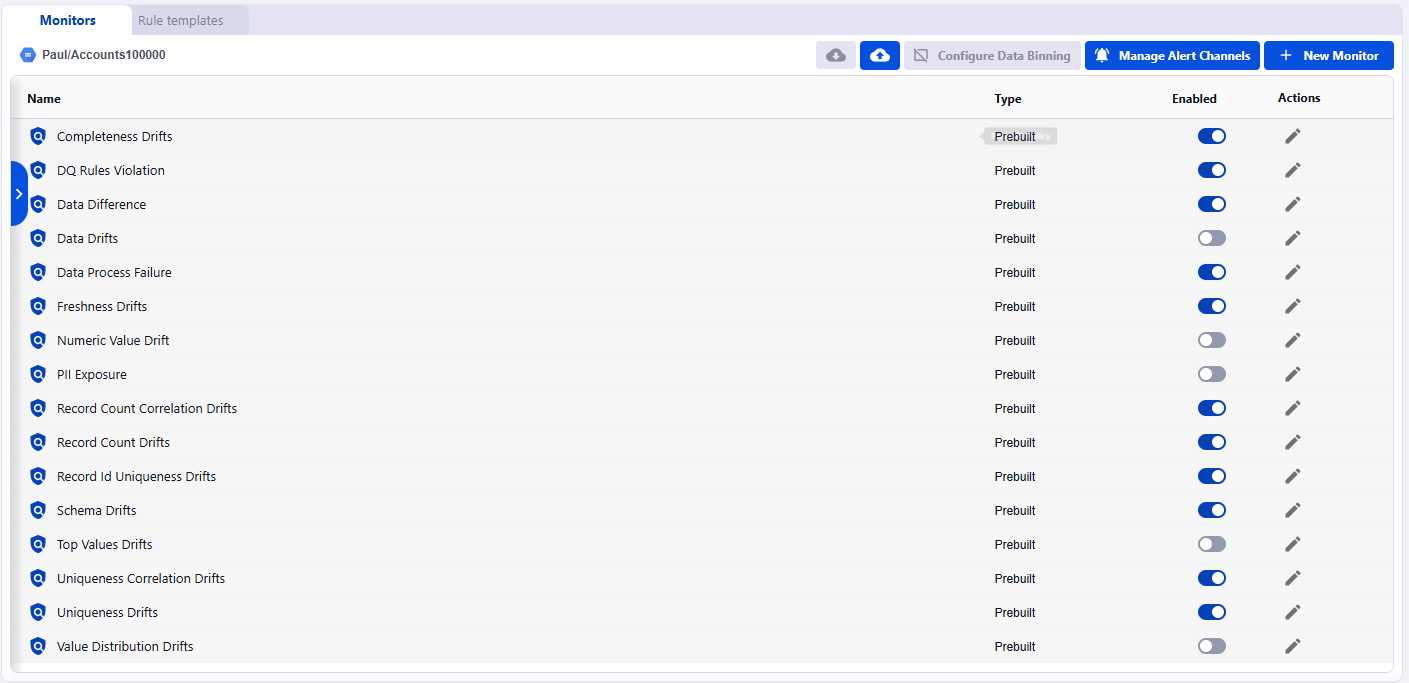
- Navigate to the Alerting Monitors page
- Select the asset you want to monitor from the left sidebar
- Click the "+ New Monitor" button in the top-right corner
Monitor Creation Panel
The monitor creation panel opens on the right side with two main sections:
Section 1: Monitor Policy: Choose your monitoring type
Section 2: Configuration: Set thresholds and conditions
Section 3: Notification: Set notification channels [optional]
Section 4: Ticketing: Set auto-ticketing requirements [optional]
Choosing Monitor Type
Select from three monitor types based on your monitoring needs:
a.png)
Important: Monitor type cannot be changed after creation. Choose carefully based on your monitoring requirements.
Configuration Section
After selecting your monitor type, configure the monitor details:
a.png)
Basic Information
| Section | Details |
|---|---|
| Monitor Name (Required) |
|
| Description (Optional) | Add context about:
|
| Monitor Tags (Optional) | Organize monitors using tags:
|
| Impact (Optional) | Set the severity level for alerts generated by this monitor:
|
Configuring Built-in Metrics
When you select Built-in Metric, you'll see the predefined metric configuration section.
Data Quality Metric (Required)
Select from available predefined metrics:
- record_count: Total number of records
- null_percentage: Percentage of null values
- freshness: Time since last data update
- completeness: Data completeness score
- uniqueness: Duplicate detection
- schema_drifts: Schema change detection
- And more...
Attributes (Optional)
For metrics that support attribute-level monitoring:
- Select specific columns to monitor
- Leave blank for table-level metrics
- Multiple attributes can be selected
Examples:
- Monitor
uniquenessoncustomer_idfield
Configuring User-Defined Metrics
When you select User-Defined Metric, you can define custom metrics using expressions or SQL.
Method 1: Expression-Based Metrics
Write simple aggregations with grouping. Example:
See full expression documentation for more examples.
Method 2: Custom SQL Queries
Write SQL queries for complex monitoring logic. Example:
SELECT AVG(order_value), customer_region, product_category
FROM `orders`
WHERE order_date >= CURRENT_DATE - 30
GROUP BY customer_region, product_category
See push down SQL documentation for more examples.
Configuring Record Validation Rules
When you select Record Validation Rule, you define checks for individual records.
Rule Definition
Write validation expressions for row-level checks:
Syntax:
See record violation rules for more examples.
Threshold Configuration
All monitor types require threshold configuration to determine when alerts are triggered.
a.png)
Threshold Types
Choose from three threshold approaches:
Automatic (ML-Based)
Let machine learning determine dynamic boundaries based on historical patterns.
Best for:
- Metrics with seasonal patterns
- Establishing initial baselines
- Adapting to data evolution
Acceptable Drift %
Set percentage-based boundaries using moving averages.
Best for:
- Relative comparisons to recent performance
- Allowing controlled variance
- Gradual data changes
Configuration:
- Define acceptable drift percentage: Set minimum & maximum drift percentage values
Acceptable Range
Define constant, fixed boundaries.
Best for:
- Hard business rules
- Strict compliance requirements
- Known acceptable limits
Configuration:
- Set minimum & maximum value
Additional Configuration Options
Compare to Past # Scans
Specify how many historical datapoints to consider:
- More scans = more stable baseline
- Fewer scans = more responsive to recent changes
- Default:
Automatic(system-determined)
Replace Missing Values
Choose how to handle gaps in your metric time series:
- Ignore: Skip missing datapoints
- Use average: Fill with calculated average
- Use zero: Treat missing as zero
Notification & Ticketing Configuration
Each monitor can be configured to send alerts and automatically create tickets when data quality issues are detected. These settings help ensure the right teams are notified and issues are tracked through resolution.
Configure where alerts should be sent when this monitor detects data quality issues.
Setting Up Alert Channels
- Click + Add Channel in the Notifications section
- Add as many predefined notification destination as needed
- Use the Enabled toggle to activate or deactivate notifications for this monitor
Note: Notifications are marked as OPTIONAL. Monitors will continue to function and track data quality even without configured alert channels.
Learn more about managing alert channels
Ticketing
Enable automatic ticket creation to track and manage data quality issues through your existing workflow tools.
Auto-Ticketing Setup
When enabled, Data Observability automatically creates a ticket in your ticketing system whenever this monitor's policy conditions are met. This ensures data quality issues are formally tracked and assigned for resolution.
To enable auto-ticketing:
- Check the Create ticket automatically checkbox
- Select a ticket Template from the dropdown
- Templates define ticket fields, priority, assignment rules, and other properties
- Templates must be configured in advance in your ticketing integration settings
- Save your monitor configuration
Note: Ticketing is marked as OPTIONAL. This feature requires a configured ticketing integration and defining templates before this feature is enabled. Learn more about managing ticketing integration with Jira.
Saving Your Monitor
Save and Cancel Actions
After configuring your monitor:
- Review all settings
- Click "Save" to create the monitor or click "Cancel" to discard changes
What Happens After Saving
- Monitor is immediately created and enabled (by default)
- Appears in the monitor list for the selected asset
- Begins evaluating data according to configured schedule
- Will generate alerts when thresholds are violated