Monitors Management
Accessing the Monitors Page
Navigate to Alerting Monitors from the main navigation menu to access all monitor management functionality.
The Monitors page provides:
- A comprehensive list of all monitors organized by asset
- Quick access to enable/disable monitors
- Edit and delete actions for each monitor
- Access to monitoring templates via the Rule templates tab
Monitor Organization
Asset Grouping
Monitors are organized hierarchically by asset in the left sidebar:
- Projects: Collapsible groups containing related assets
- Assets: Individual data sources (tables, views, files) with their associated monitors
- Monitor List: All monitors for the selected asset displayed in the main panel
Navigation tips:
- Click the arrow (▸) to expand/collapse asset groups
- Use the search bar to quickly find specific assets
- Select an asset to view all its monitors
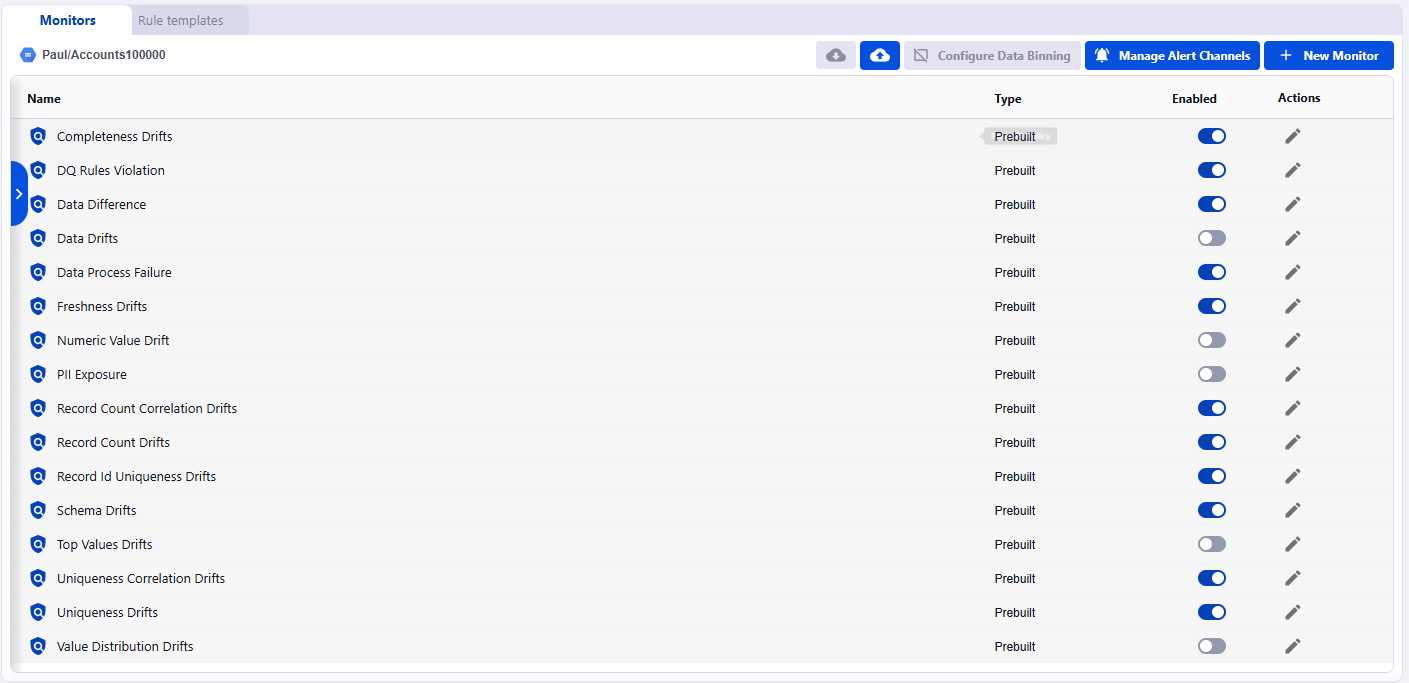
Monitor List View
The main panel displays all monitors for the selected asset with the following information:
| Column | Description |
|---|---|
| Name | Monitor name with type indicator (NEW, built-in, custom) |
| Type | Monitor type |
| Enabled | Toggle switch to enable/disable the monitor |
| Actions | Edit (✏️) and Delete (🗑️) buttons |
.png)
Monitors Actions
The Monitors page provides several top-level actions:
Configure Data Binning
Set up data binning rules to control how Data Observability bins your data.
Learn more about data binning.
.png)
Manage Alert Channels
Configure notification destinations including Slack, email, webhooks, and other integrations to ensure alerts reach the right teams. Learn more about managing notifications.
.png)
+ New Monitor
Click + New Monitor to build custom monitors tailored to your specific data quality requirements. Learn more about creating monitors.
.png)